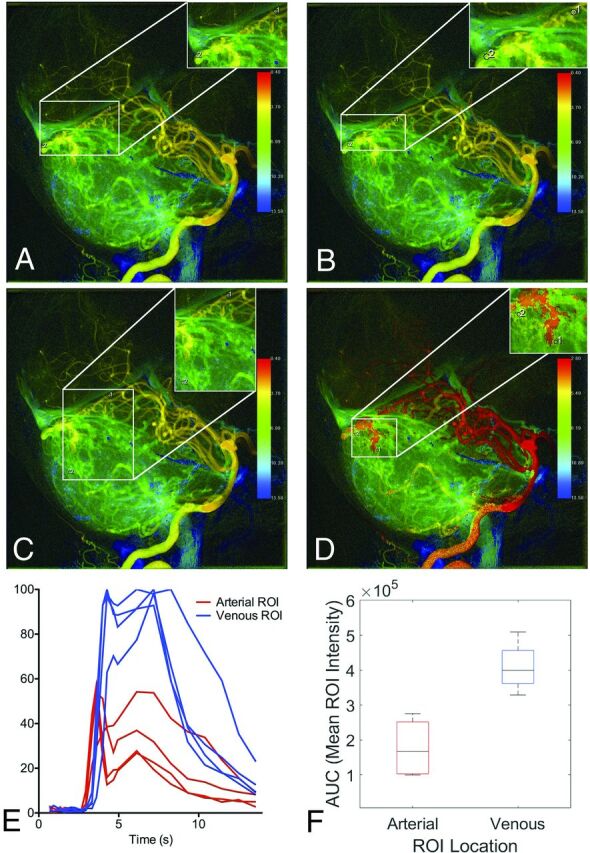
FIG 2.

cDSA with high variance among raters in MTT results. Left vertebral arteriogram in a lateral projection shows a cerebellar AVM with arterial supply from the left SCA and left PICA and venous drainage into vermian and tentorial veins. A and B, Raters 1 and 2 placed ROIs on the same vessels, the SCA and tentorial vein, at nearly the same location, yet the MTT for rater 1 (A) is 3.6 seconds, while the MTT for rater 2 is 0.7 seconds. The venous time-density curve for rater 1 (A) has a larger second peak, which increased the calculated venous TTP. Rater 1 (A) placed the ROI on a draining vein where it overlaps with a normal draining vein, and the second peak is a manifestation of the normal venous phase of the angiogram. C, Rater 3 selected an inferior vermian vein rather than a tentorial vein for venous ROI placement. D, Rater 4 selected the left PICA rather than the SCA for arterial ROI placement. Differences in ROI placement result in different time-density curves (E) and calculated AUCs (F).
