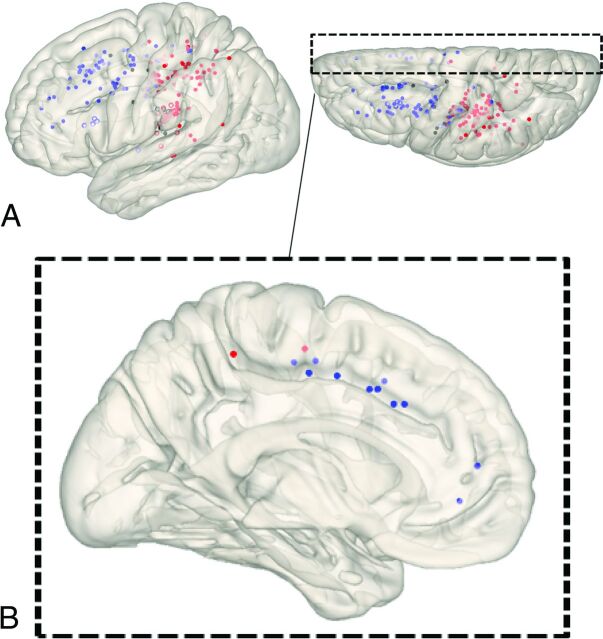
FIG 4.
Cortical distributions of each type of collateral depicted on a standard brain surface model. Each dot shows the point where each anastomosis outflowed to the cortex (blue dot, lenticulostriate anastomosis; black dot, thalamic anastomosis; red dot, choroidal anastomosis). White circles (circles without fill) show dots located on the insular cortex. A, All dots are depicted on a brain surface model. B, The view from the medial surface of a 3D brain surface model. Dots were extracted that exist within 15 mm from the midline.

