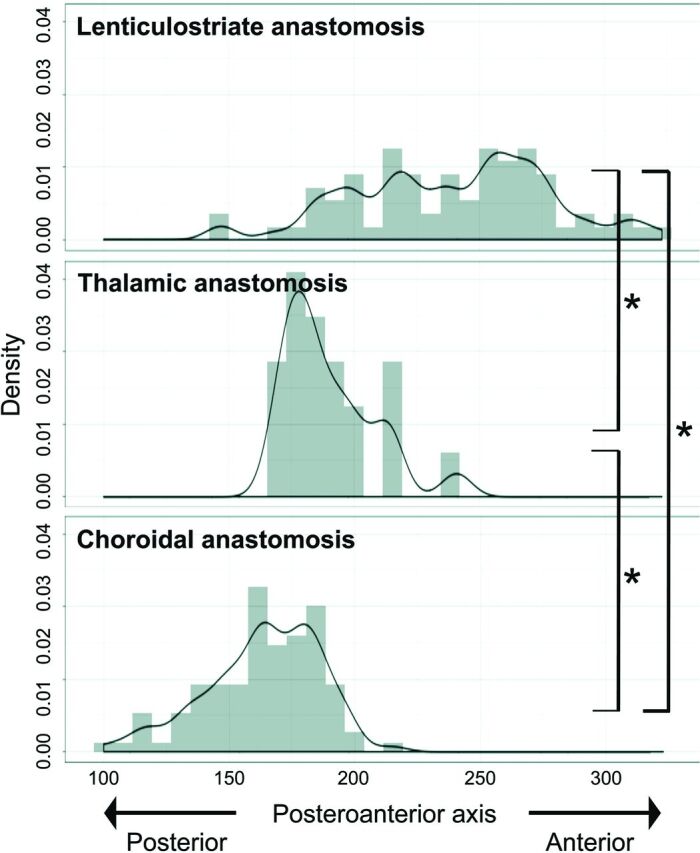
FIG 6.

Posteroanterior (y-coordinate) distribution of outflow to the cortex for each type of anastomosis. The value for the posterior edge of images is 1, and the value for the frontal edge of images is 395. Values for y-coordinates are shown as density estimations. The asterisk indicates P < .001.
