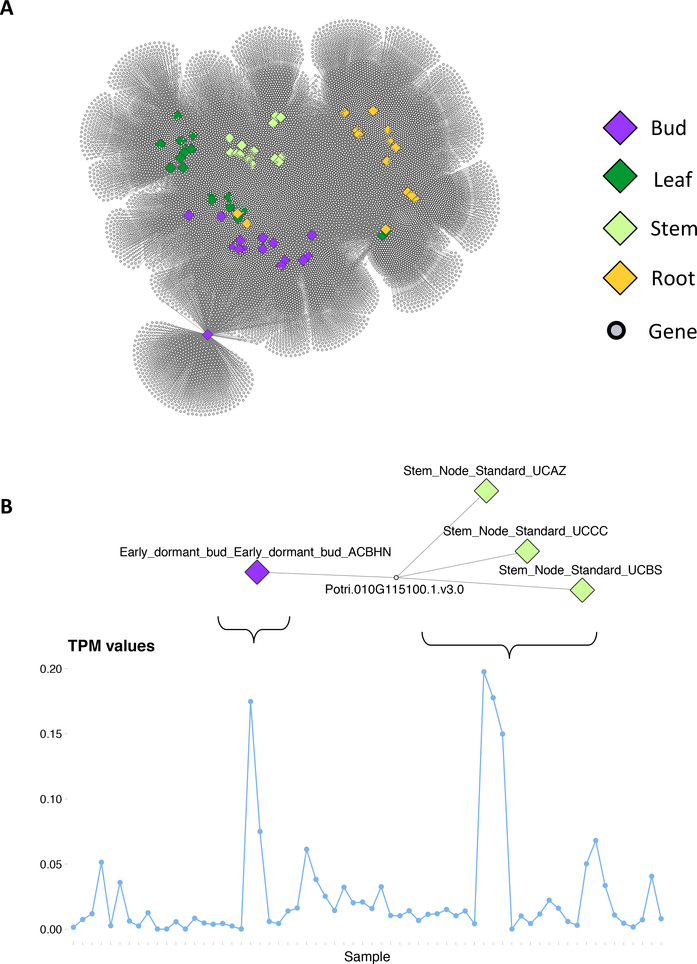
Fig. 3. Enrichment Network:
(A) Enrichment network for the P. trichocarpa gene atlas. Large diamond nodes represent samples, colored according to source tissue. Small grey nodes represent genes. An edge connects a gene to a sample if that gene’s expression is significantly expressed in that sample, as determined using the right-tailed Fisher exact test and FDR correction. (B) An example of a gene enriched in 4 of the samples and the expression profile (TPM values) of the gene.

