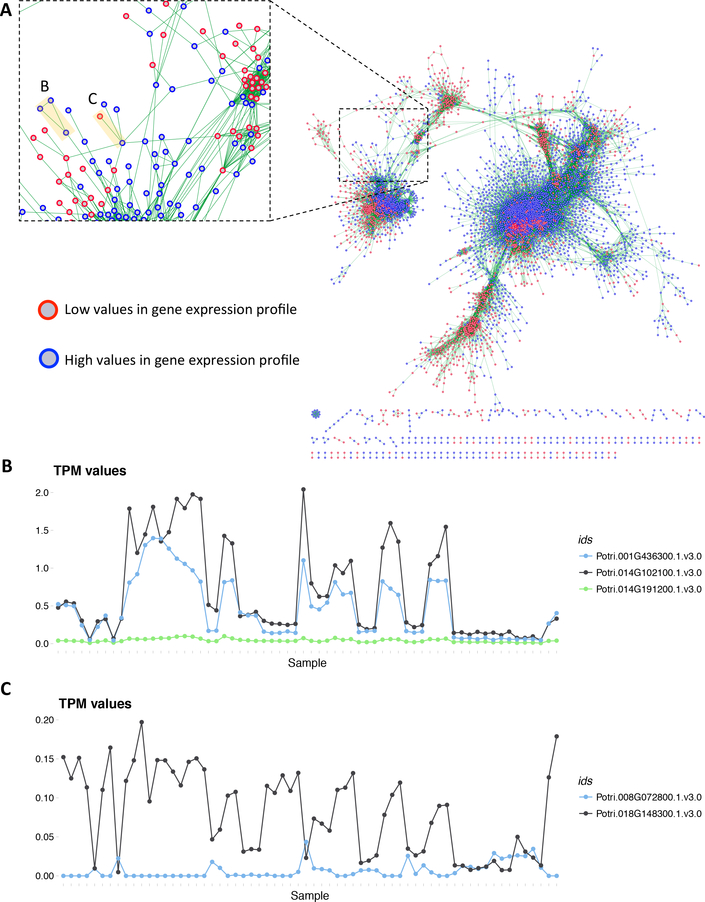
Fig. 5. DUO Network.
(A) DUO co-expression network for the P. trichocarpa gene expression atlas. Blue bordered nodes represent high expression values for a given gene, red-bordered nodes represent low expression values for a given gene. An edge (green) between two nodes represents the co-occurrence between the expression values of the two genes it connects, calculated using the DUO metric. (B) Expression profiles (TPM values) for the three genes highlighted B in panel A. (C) Expression profiles (TPM values) for the two genes highlighted C in panel A.

