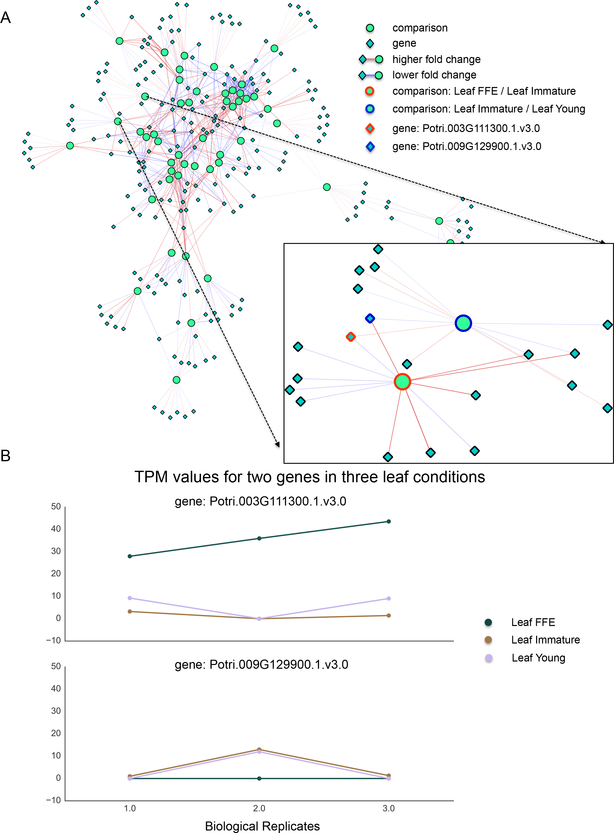
Fig. 6. FCROS Network.
(A) Network visualization of the differential results from the P. trichocarpa gene atlas gene expression data. Round light green nodes indicate comparisons between sample groups against which differential genes, the dark green diamond nodes, were tested. An edge between a gene node and a comparison node indicates that the given gene was significantly differentially expressed in the respective comparison. The color of the edge indicates whether not not then gene was over (red) or under expressed (blue) in the comparison. The over/under association is determined relative to the sample name that appears first in the comparison node label. The color intensity of the edge correlates with the absolute log fold change of expression. The box depicts the genes connected to the indicated leaf comparison nodes, here two genes are highlighted. (B) Lines plot for the two highlighted genes under the three conditions described by the two comparison nodes. The x-axis indicates replication, y-axis the TPM value and each line represents a particular sample. Here we see that the algorithm reveals both dramatic differences between conditions as well as more subtle differences.

