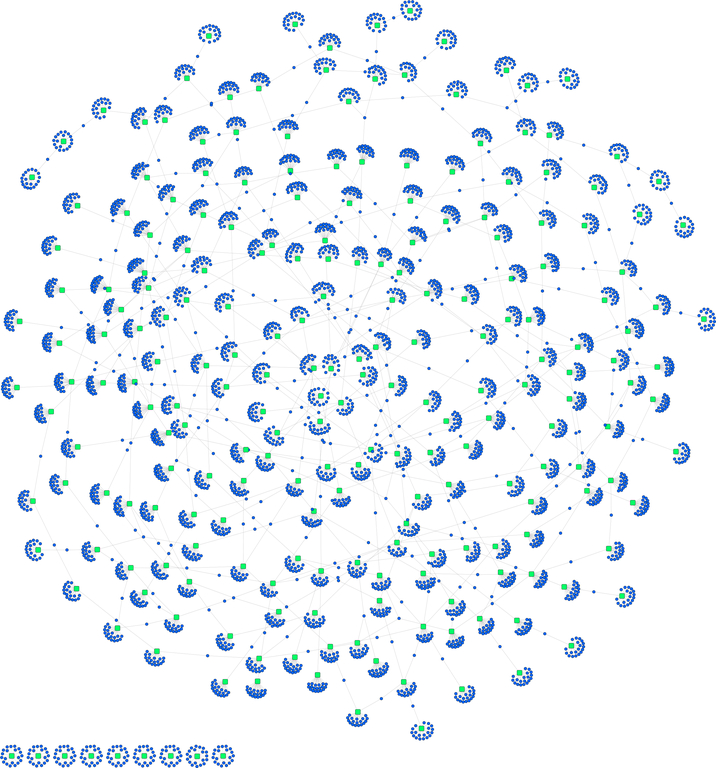
Fig. 7. Random Forest Network.
Network visualization of the top 20 important variables in an all pairs comparison of samples, grouped by replicates. The underlying data is from the P. trichocarpa gene atlas gene expression data set. Round purple nodes indicate genes, while square green nodes indicate the group comparisons that was performed. The network is mostly connected by means of one or two shared genes between certain groups comparisons. Though, as expected there are some disjoint groupings as well.

