
FIGURE 3.
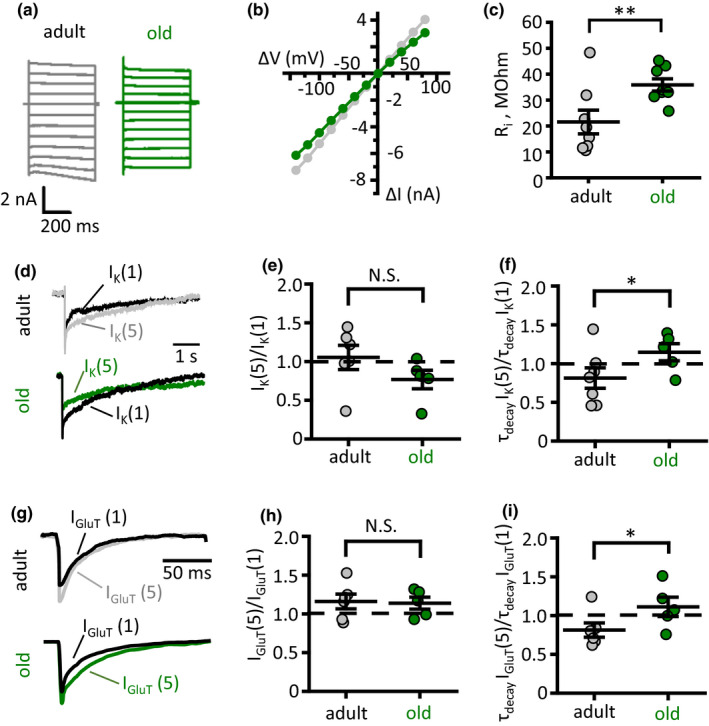
Astrocyte dystrophy enhances glutamate and K+ spillover. (a) Recordings of astrocytic currents in response to voltage steps (from −140 mV to +80 mV with 20‐mV interval) delivered through patch pipette to voltage‐clamped adult (grey traces) and old (green traces) astrocytes. (b) Current–voltage (I‐V) relationships based on responses presented on panel (a). ΔV—voltage step amplitude, ΔI—current response. (c) Summary of astrocyte input resistance (Ri). (d) Astrocytic currents in response to stimulation of Schaffer collaterals: IK(1)—response to a single stimulus; IK(5)—isolated response to 5th stimulus in burst stimulation (5 stim × 50 Hz minus 5 stim × 50 Hz). Top—adult, bottom—old mouse. (e and f) Summary of activity‐dependent change in the amplitude [IK(1)/IK(5), e] and the decay time of K+ current [τdecayIK(5)/τdecayIK(1), f]. (g) Glutamate transporter‐mediated current—astrocytic currents in response to stimulation of Schaffer collaterals after subtraction of K+ current: IGluT(1)—response to a single stimulus; IGluT(5)—isolated response to 5th stimulus in burst stimulation (5 stim x 50 Hz minus 5 stim x 50 Hz). Top—adult, bottom—old mouse. (h and i) Summary of activity‐dependent change in the amplitude [IGluT(1)/IGluT(5), h] and the decay time of glutamate transporter current [τdecayIGluT(5)/τdecayIGluT(1), i]. Grey circles—adult, green circles—old mice. The data are presented as the mean ±SEM. N.S. p > 0.05; *p < 0.05; **p < 0.01; two‐tailed two‐sample t‐test