
FIGURE 1.
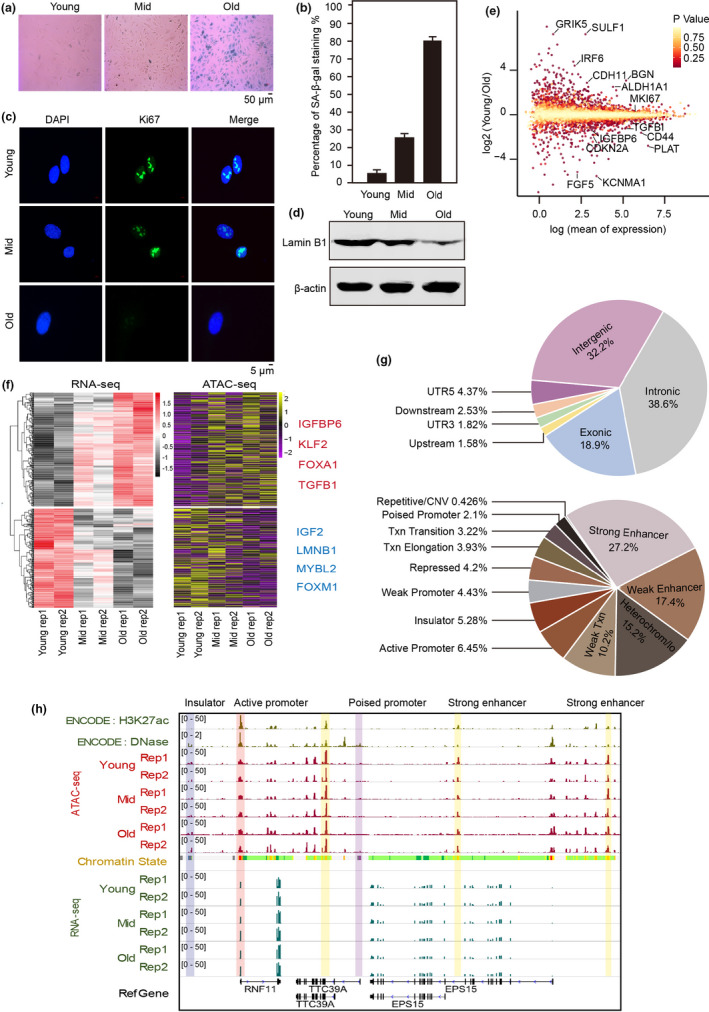
The genome‐wide landscape of gene expression and chromatin accessibility for replicative senescence. (a) SA‐β‐gal (senescence marker) stained young (PD8), middle‐aged (PD24), and old (PD36) human umbilical endothelial vein cells (HUVECs). PD, population doublings. (b) SA‐β‐gal‐positive HUVECs increased with number of passages. (c) Immunofluorescence of representative Ki67‐stained, serially passaged HUVECs. (d) Western blots showing Lamin B1 expression during HUVEC senescence. β‐Actin served as the loading control. (e) Dispersion plots of RNA‐seq signals showing the changes in selected genes’ expression between young and old HUVECs. (f) Heatmaps of HUVEC RNA‐seq and ATAC‐seq data sets at 3 age points with genes grouped according to similar gene expression patterns. Genes that were consistent between expression and promoter accessibility during senescence are listed to the right. Two independently repeated experiments were performed in each category (rep 1 and 2). (g) Annotations of all open chromatin regions. The upper pie chart shows the genomic features for the open chromatin regions, and the lower one shows the chromatin states. These results were generated from all ATAC‐seq peaks of three samples (young, mid, old). CNV, copy‐number variation; Txn, transcribed region; UTR, untranslated region. (h) Snapshot showing the signals of RNA‐seq, ATAC‐seq, H3K27ac, and DNase‐seq in example regions. The vertical gray box highlights the ATAC‐seq signals in insulator, enhancer and promoter. Chromatin states were obtained from ENCODE (light yellow = weak/poised enhancer, dark yellow = strong enhancer, green = transcribed region, blue = insulator, and gray = heterochromatin). Two biological replicates were performed of each condition (rep 1 and 2)