
FIGURE 2.
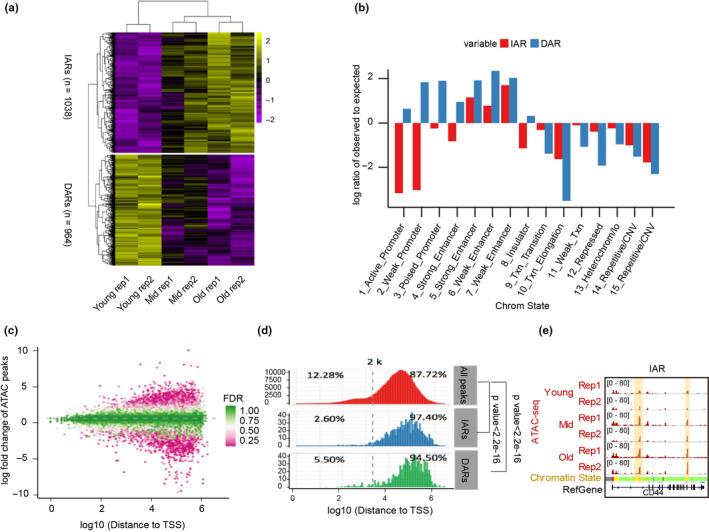
Dynamics of chromatin accessibility during senescence. (a) Heatmap of hierarchically clustered ATAC‐seq signals showing the accessibility remodeling of senescence‐related chromatin regions with increased accessibility (IARs) and senescence‐related chromatin regions with decreased accessibility (DARs) during senescence. Two biological replicates were performed in each category (rep 1 and 2). (b) Enrichment of chromatin states at IARs and DARs. (c) Scatter diagram showing alterations of ATAC‐seq signals between young and old cells in all peaks and with different distances to transcription start sites (TSSs). Most of the regions that changed markedly in senescence are far from their TSSs. FDR, false discovery rate. (d) The distributions of the distances between ATAC‐seq peaks (all peaks, IARs and DARs) and the TSSs. (e) Signal distributions of ATAC‐seq signals, DNase‐seq, and H3K27ac in or near the TMCO5A during HUVEC senescence. The vertical yellow box shows the gradually increased ATAC‐seq signals in annotated enhancer regions. See Figure 1 for senescence stage definitions and chromatin state information