
FIGURE 4.
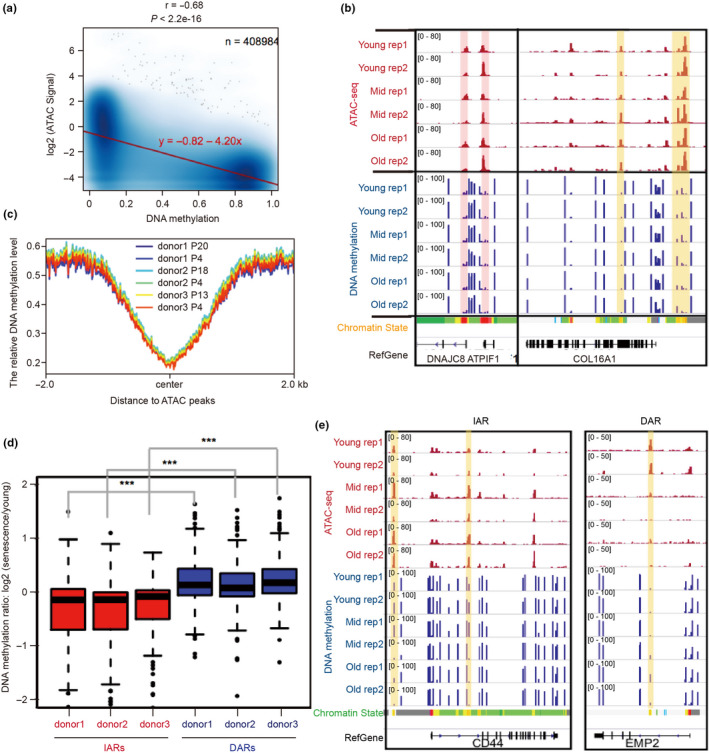
DNA methylation may help establish chromatin accessibility. (a) The correlation of chromatin accessibility and DNA methylation in all ATAC‐seq peaks during HUVEC senescence. (b) ATAC‐seq and DNA methylation signals near DNAJC8, ATPIF1, and COL16A1. The red and yellow vertical boxes show the opposite trend between ATAC‐seq and DNA methylation signals. (c) Distribution of DNA methylation signals around ATAC peaks. (d) The box plots showing DNA methylation level changes at IARs and DARs during senescence. The HUVECs were donated from three volunteers: donor 1, donor 2, and donor 3. The y‐axis represents the logarithm ratio of 5‐methylcytosine (5mC) levels in senescent cells to that in young cells. Two‐tailed, unpaired Student's t tests were performed. ***p < 0.001. (e) Changes in DNA methylation and ATAC‐seq signals in the IARs near CD44 (left) and the DAR near EMP2 (right) during senescence. The vertical yellow boxes show IARs and DARs. For (b) and (e), 2 independently repeated experiments were performed in each category (rep 1 and 2). See Figure 1 for senescence stage definitions and chromatin state information