
FIGURE 5.
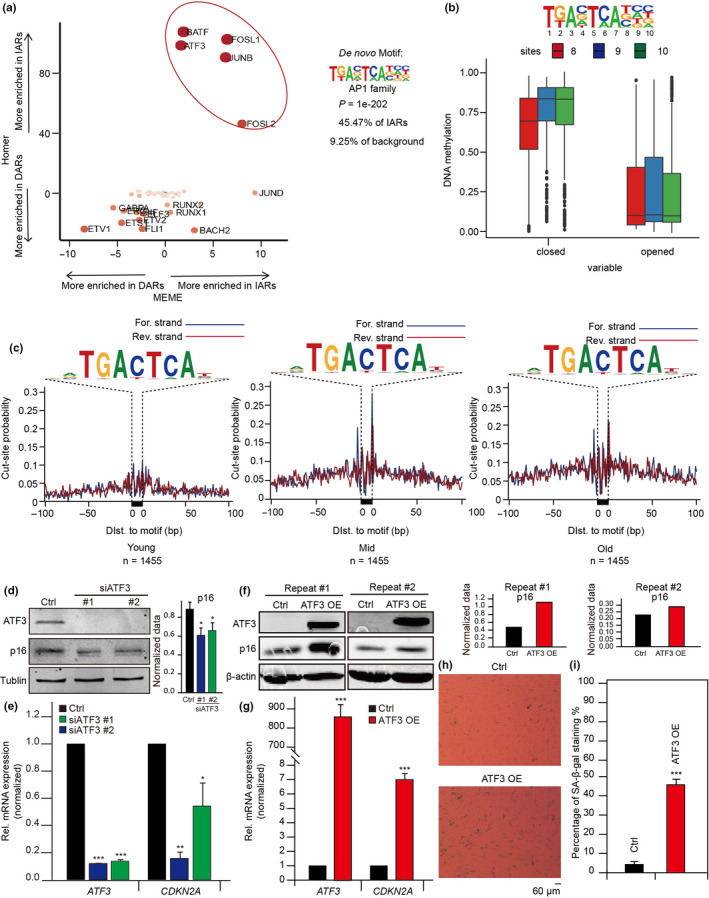
AP‐1 promotes senescence by regulating the accessibility of IARs. (a) Comparison of HOMER and MEME motif enrichment analyses of transcription factors at IARs and DARs. (b) Comparisons of DNA methylation at AP‐1 motif sites 8, 9, and 10 for both closed and open chromatin. (c) ATAC‐seq footprint analyses of ATF3 as HUVEC senescence. See Figure 1 for senescence stage definitions. (d) Western blots showing ATF3 and p16 protein levels after knocking down ATF3 with its siRNA. Tubulin served as the loading control. The gray value of p16 blots was quantified by ImageJ 1.52a and normalized to tubulin (n = 3 experiments, *p < 0.05). (e) RT‐qPCR assay for the mRNA levels of ATF3 and CDKN2A after knocking down ATF3 with its siRNA. The cycle threshold (Ct) of ATF3 and CDKN2A was normalized with ACTB. (f) The proteins levels of ATF3 and p16 in ATF3‐overexpressed HUVECs measured by Western blots. β‐Actin served as the loading control. OE, overexpression. The gray value of p16 blots was quantified by ImageJ 1.52a and normalized to β‐actin. (g) The mRNA expression of ATF3 and CDKN2A in ATF3‐overexpressed HUVECs measured by RT‐qPCR. The cycle threshold (Ct) of ATF3 and CDKN2A was normalized with ACTB. (h) SA‐β‐gal staining assay shows the difference of senescence phenotypes in ATF3‐overexpressed and in control HUVECs. (i) Statistical comparison of SA‐β‐gal‐positive cells in (h). The error bars represent the s.d. obtained from triplicate independent experiments. Two‐tailed, unpaired Student's t tests were performed. *p < 0.05, **p < 0.01, and ***p < 0.001