
FIGURE 5.
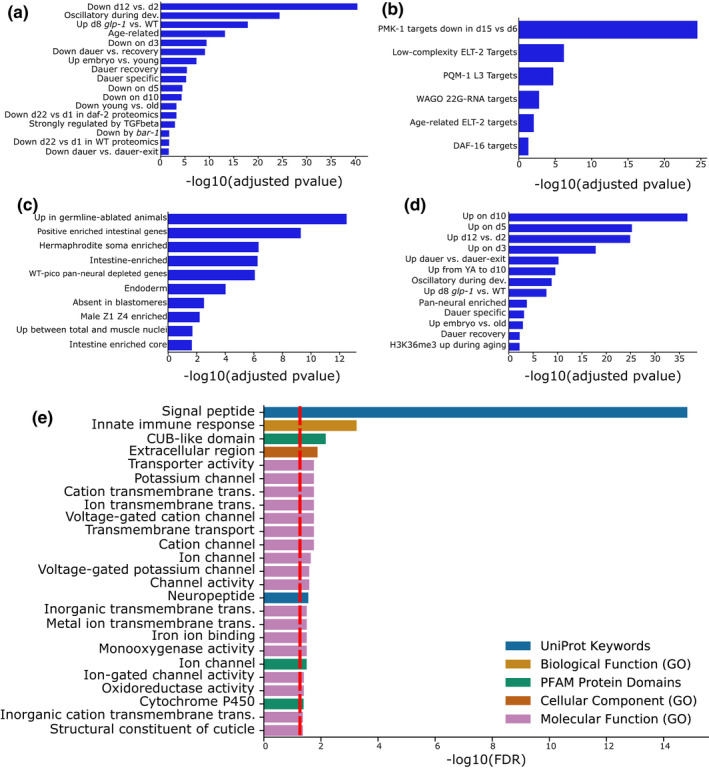
Functional analysis of the predictor genes. (a–d) WormExp gene set enrichment analysis for the 576 predictor genes. The x‐axis displays the −log10 of the adjusted p‐value. Only statistically significant (adjusted p < 0.05) enrichments are shown. (a–c) Gene set enrichment analyses for the genes with a coefficient ≤0 for the Development/Dauer/Aging category (a), the TF Targets category (b), and the Tissue category (c). (d) Gene set enrichment analyses for the genes with a coefficient >0 for the Development/Dauer/Aging category. (e) Functional enrichment analysis for the 576 predictor genes by String and geneSCF. The x‐axis displays the −log10 of the FDR. The red line displays an FDR of 0.05. Different enrichment categories are color‐coded