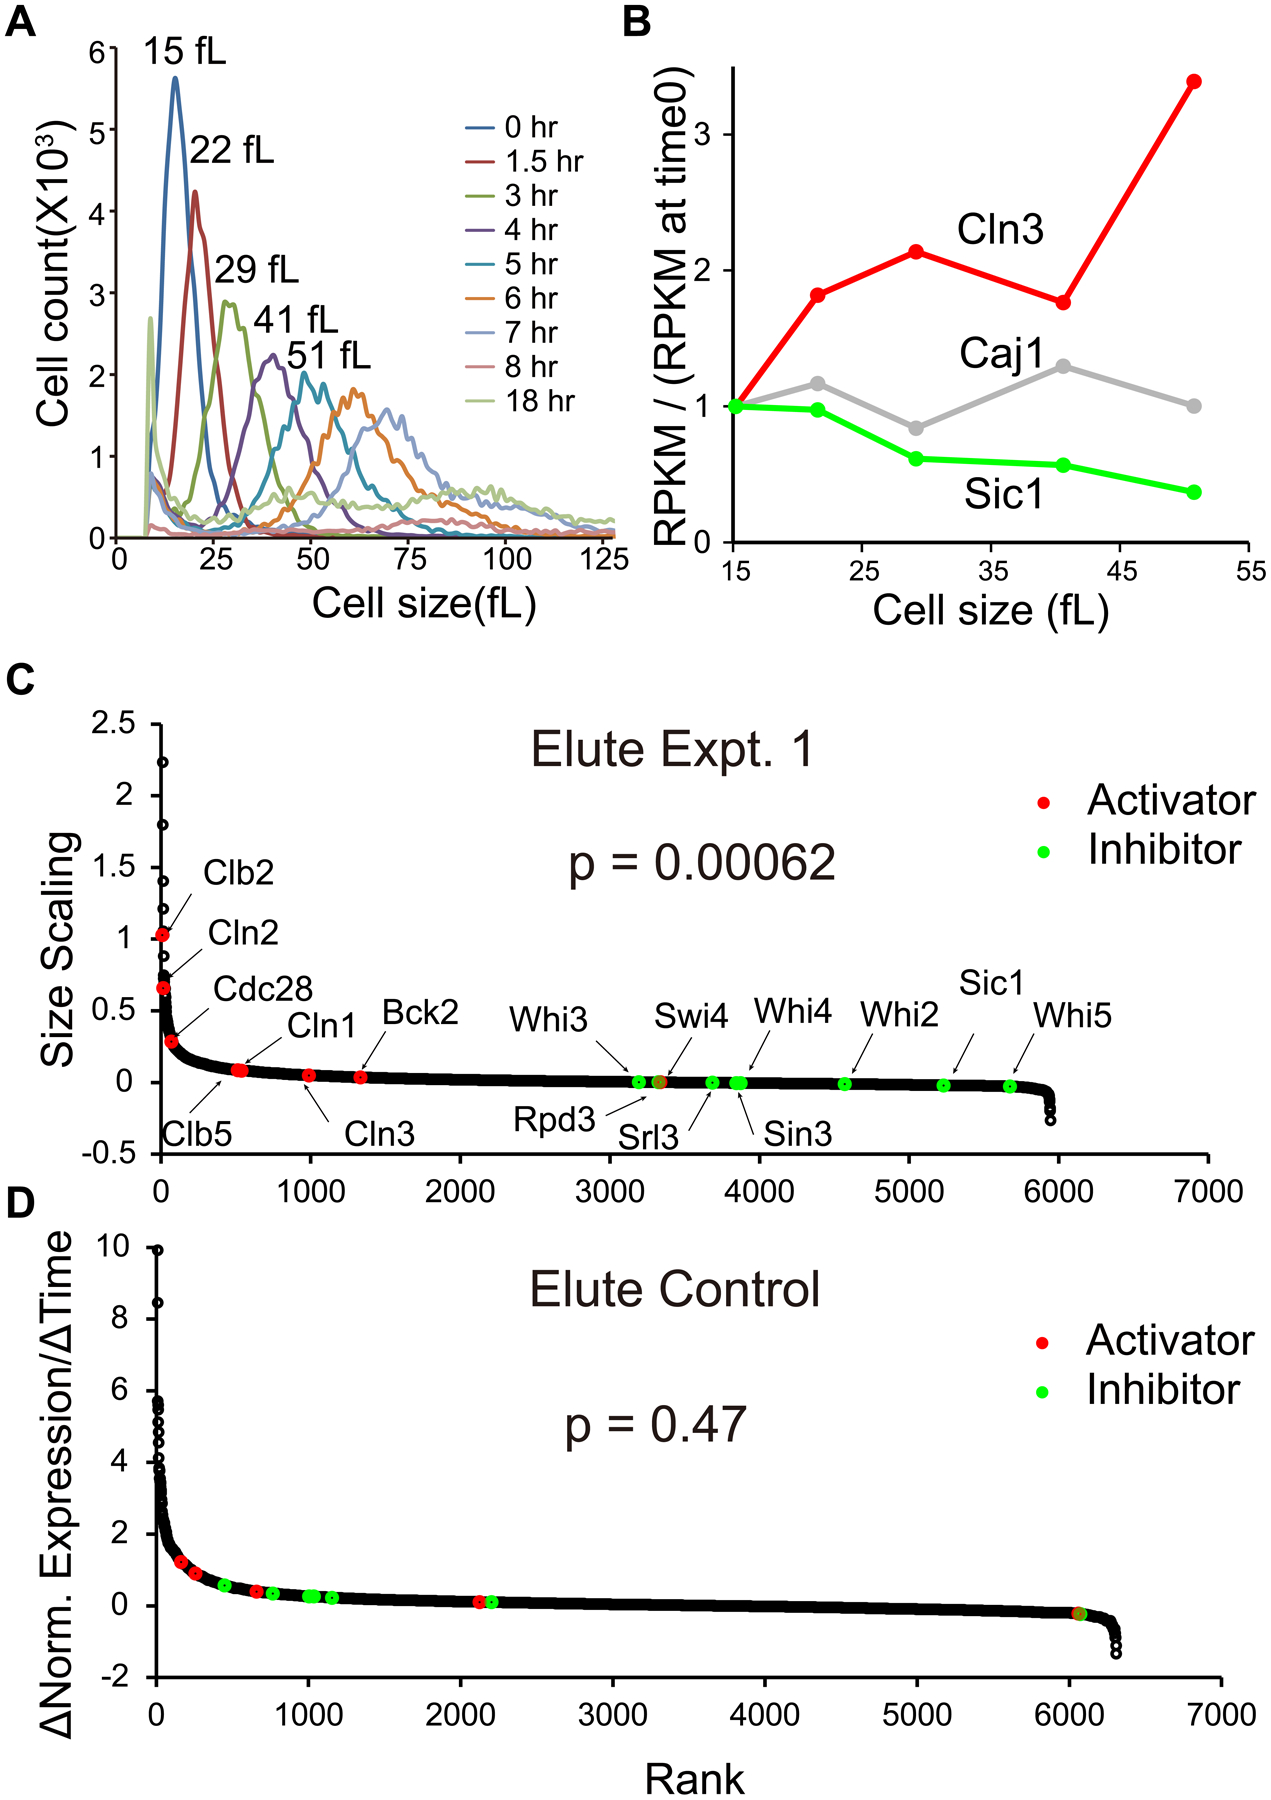
Fig. 2. Scaling of expression of cell cycle activators and inhibitors with cell size.

A. Cell size distributions in elutriation expt. 1.
B. For example genes, concentrations of mRNA at sizes of 15, 22, 29, 41, and 51 fL are compared to initial (15 fL) concentration of mRNA. mRNAs were measured as RPKM (Reads Per Kilobase per Million mapped reads), and the ratio of RPKM(sample 0 to 4)/RPKM(sample 0) (“concentration”) for each gene is plotted against cell size. Best-fit linear regression lines and slopes were calculated.
C. For each mRNA, a best-fit line and slope was calculated for [RPKM(sample 0 to 4)/RPKM(sample 0)], as in B. We call these slopes “size scaling values”. Each gene is plotted as a dot, ranked left to right by size scaling value. A large size scaling value (i.e., large positive slope) means the mRNA scales faster-than-size, i.e., increases in concentration as the cell grows. Pre-selected cell cycle activators are colored red, and inhibitors green. The Wilcoxon p-value was calculated for a rank difference between activators and inhibitors. The experiment was done three times with similar results (see Fig. 3).
D. Elutriation control. CDC28 cells were held in the elutriation chamber during centrifugation, then flushed out without size separation. 1NMPP1 inhibitor was added, but these cells were not sensitive to the inhibitor. Samples were taken processed and analyzed as in panel C.
