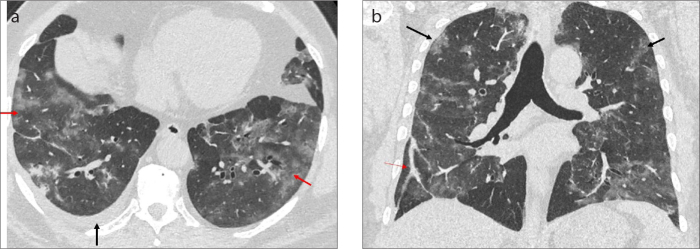
Figure 20. a, b.
Axial CT image (a) of a 60-year-old male COVID-19 pneumonia patient presenting with dyspnea shows right pleural effusion (black arrow) and GGOs in bilateral lower lobes (red arrows). Coronal CT image (b) shows the extension of GGOs to upper lobes (black arrows) and subpleural line (red arrow) at the right lower lobe.

