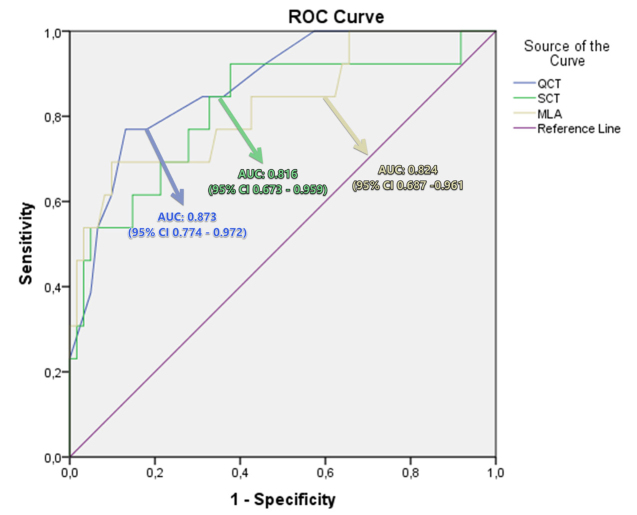
Figure 3.
Receiver operating characteristic (ROC) curve analysis was obtained to differentiate extensive disease from limited disease in patients with COVID-19. Quantitative CT (QCT) score had an area under the curve (AUC) of 0.816 (95% CI 0.673–0.959), semiquantitative CT (SCT) score had an AUC of 0.873 (95% CI 0.774–0.972), and mean lung attenuation (MLA) value had an AUC of 0.824 (95% CI 0.687–0.961).

