
FIGURE 3.
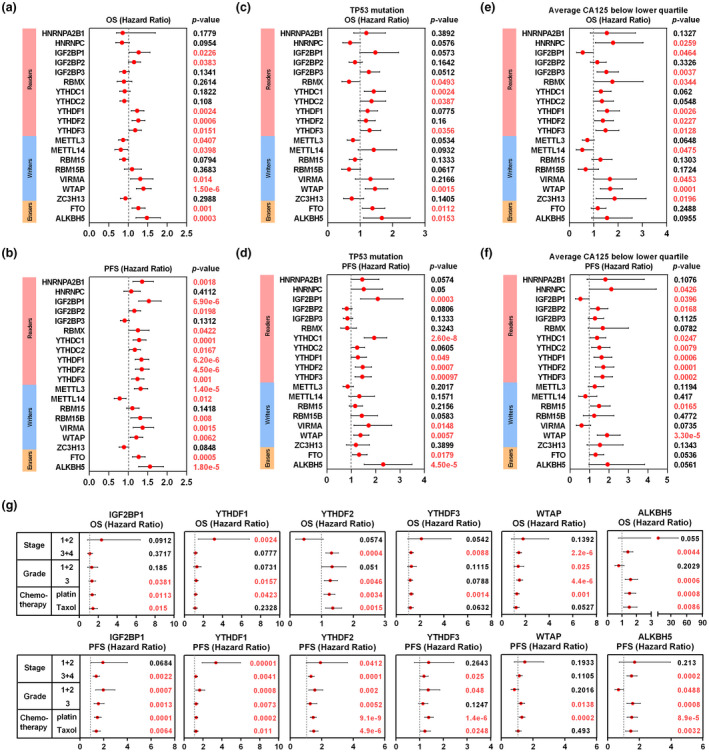
Prognostic value of m6A regulators in ovarian cancer. (a and b) The distribution of hazard ratios of OS and PFS across m6A regulators in ovarian cancer patients from Kaplan–Meier plotter database (http://kmplot.com/analysis/). (c and d) The distribution of hazard ratios of OS and PFS in patients with TP53 mutation. (e and f) The distribution of hazard ratios of OS and PFS in patients with the status of CA125 level below lower quartile. (g) The distribution of hazard ratios of OS and PFS in patients with different grades, stages, and chemotherapy