
FIGURE 5.
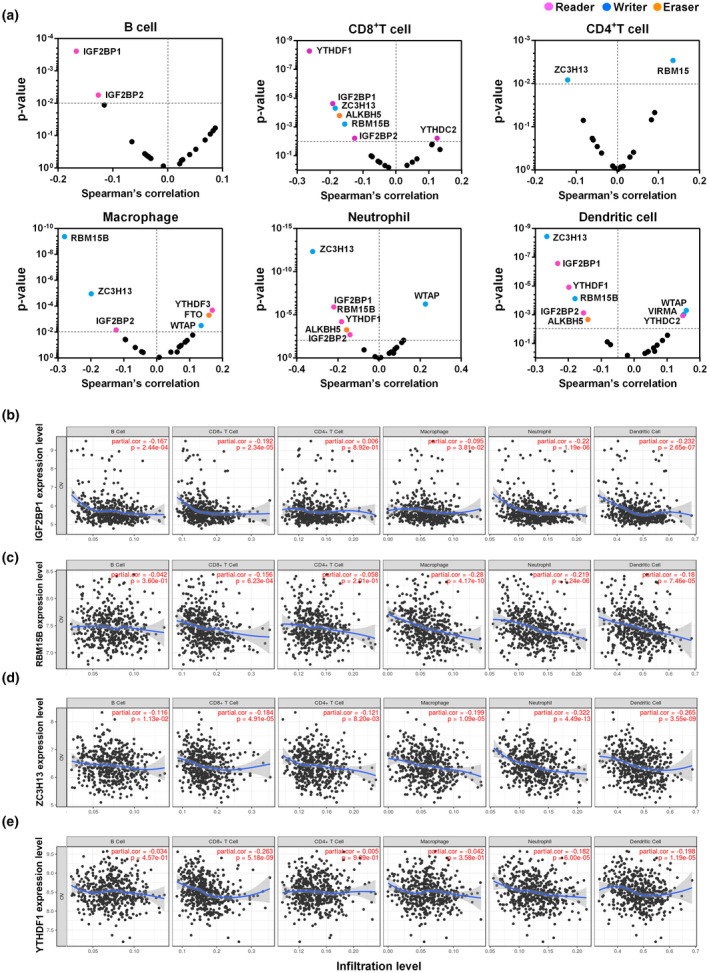
Correlation between immune cell infiltration and the expression of m6A regulators in ovarian cancer. (a) Correlation between the expression of m6A regulators and infiltrating levels of B cells, CD8+ T cells, CD4+ T cells, macrophages, neutrophils, and dendritic cells in ovarian cancer. (b–e) Correlation between the expression of specific m6A regulators (IGF2BP1, RBM15B, ZC3H13, and YTHDF1) and infiltrating levels of B cells, CD8+ T cells, CD4+ T cells, macrophages, neutrophils, and dendritic cells in ovarian cancer