
FIGURE 2.
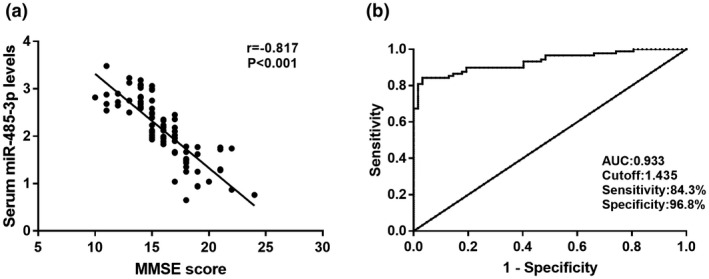
The correlation of serum miR‐485‐3p expression with MMSE score and diagnostic value of miR‐485‐3p in AD patients. (a) The serum miR‐485‐3p expression was negatively correlated with the MMSE score (r = −0.817,p < 0.001). (b) ROC curve based on serum miR‐485‐3p expression for AD patients was plotted. The area under the curve (AUC) was 0.933, demonstrating the diagnostic accuracy of miR‐485‐3p