
FIGURE 1.
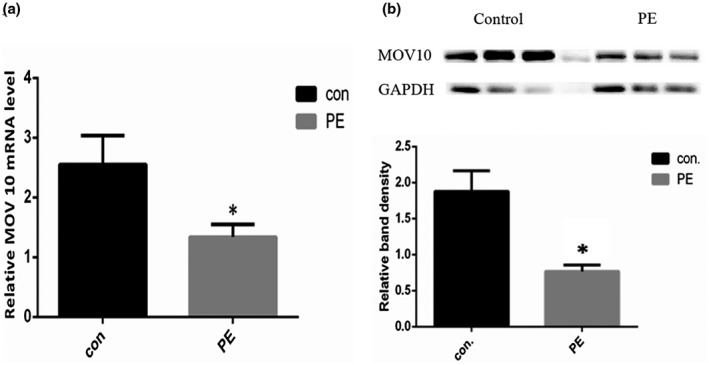
Expression of MOV10 in placenta. a, Relative mRNA expression level of MOV10 in placental tissue measured by qPCR. Data for controls (n = 52) and cases (n = 48) were compared. Data represent mean ±SE. *represents p < 0.05 versus the control group. b, The expression levels of MOV10 protein in placenta measured by western blot. The relative band density of two groups was processed by ImageJ software. Data represent mean ±SE. *represents p < 0.05 versus the control group.