Figure 1.
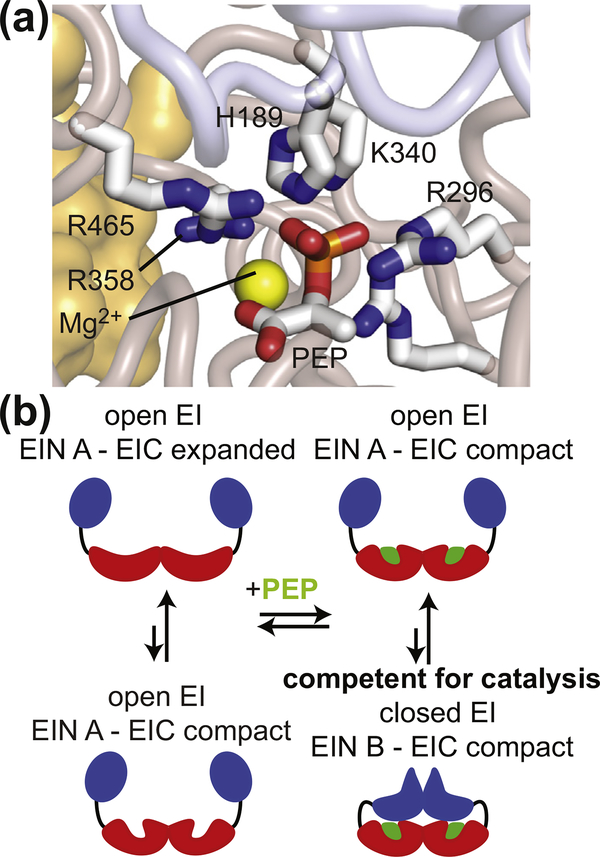
EI conformational rearrangements during catalysis. (a) Structural model of PEP bound in the active site of closed EI. Modeling was performed based on the crystal structure of the tEIC–PEP complex [15] and on the X-ray structure of a phosphorylated eEI intermediate captured immediately after the autophosphorylation reaction [16]. Details on the modeling are provided elsewhere [17]. The positioning of PEP and of the His189 side-chain allows in-line phosphoryl transfer from PEP bound to the EIC domain to the EIN domain. PEP, the side-chain of His189, and side-chains of residues from the EIC domain that interact with the phosphate group of PEP are shown as solid sticks. The magnesium ion is displayed as a yellow sphere. The backbone of the EIN and EIC domains are shown as transparent blue and salmon tubes, respectively. The second subunit is shown as a transparent orange surface. (b) Schematic view of EI conformational equilibria. The EIN and EIC domains are colored blue and red, respectively. The PEP molecule is colored green.

