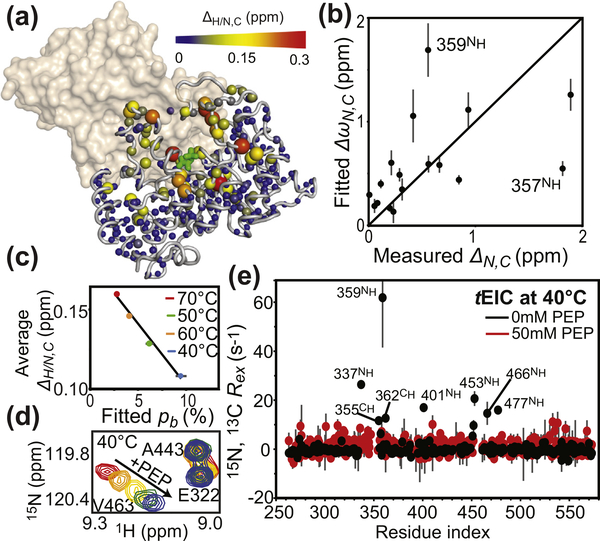
Figure 3.
NMR analysis of holo tEIC. (a) Weighted combined chemical shift perturbations (ΔH/N,C) induced by 10 mM PEP on the 1H–15N and 1H–13Cmethyl TROSY correlation spectra of tEIC displayed on the structure of the tEIC–PEP complex as spheres with the relationship between size and color of each sphere and chemical shift perturbation depicted by the color bar. ΔH/N,C values are displayed on one subunit of the EIC dimer. The second subunit is shown as a transparent surface. (b) The ΔωN,C parameters obtained from the fits of the RD data on apo tEIC are plotted versus the 15N and 13C chemical shift perturbations (δN,C) induced by addition of 10 mM PEP to tEIC at 70 °C. Tyr357 and Ala359 show a poor agreement between ΔωN and ΔN. These residues are adjacent to Arg358 that establishes salt-bridges with the phosphate group of PEP. Therefore, the presence of PEP is likely to induce additional perturbations to the 15N chemical shift of Tyr357 and Ala359 that are not reflected in the corresponding ΔωN (which is fitted from RD data on the apo protein). (c) ΔH/N,C measured at different temperatures for tEIC are averaged over all the NMR peaks and plotted versus the population of compact state obtained by fitting the RD data on the apo protein. Data measured at 40, 50, 60, and 70 °C are shown as blue, green, orange, and red circles, respectively. Linear regression of the data is shown as a solid black line. (d) Close-up view of the 1H–15N TROSY spectrum of tEIC showing the effect of increasing concentrations of PEP on selected cross-peaks at 40 °C. The color code is as follows: red, 0 mM PEP; orange, 0.2 mM PEP; yellow, 0.5 mM PEP; green, 1.0 mM PEP; blue, 2.0 mM PEP. The fact that peak position follows a linear path upon increasing PEP concentration indicates that the free and bound forms of tEIC are in fast exchange [35]. (e) Exchange contribution to the transverse relaxation rates (Rex) at 800 MHz and 40 °C measured for samples of tEIC in the absence (black) and in the presence (red) of 50 mM PEP. As PEP is slowly degraded by the enzyme, RD data for holo tEIC were measured in the presence of a large excess of substrate and using a low protein concentration (300 μM) and a low number of scans (16) for NMR signal averaging. Therefore, we ascribe the small fluctuations in Rex observed for holo tEIC to experimental error.

