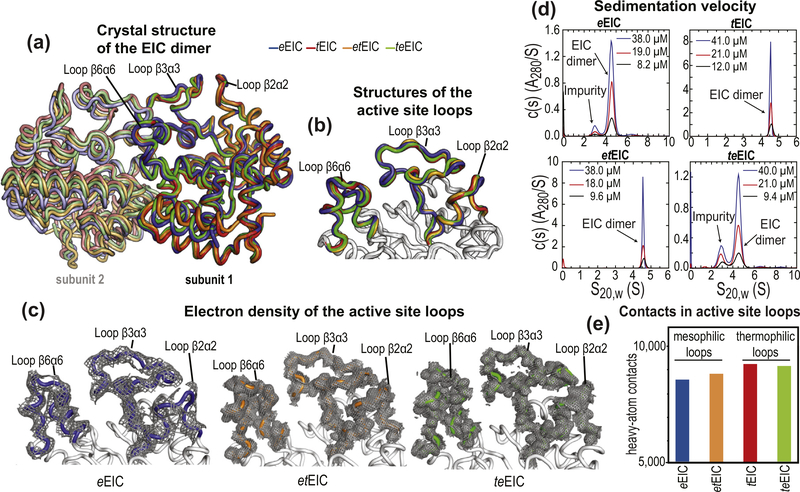
Figure 5.
Crystal structures of EIC. (a) Overlay of the crystal structure of eEIC (blue), tEIC (red), etEIC (orange), and teEIC (green). Subunits 1 and 2 are indicated with bright and pale colors, respectively. (b) Close-up view of the active-site loops in eEIC (blue), tEIC (red), etEIC (orange), and teEIC (green). Statistics for crystal structure of eEIC, etEIC, and teEIC (obtained in this work) are shown in Supplementary Table S3. (c) Electron density maps (2fo − fc) of the active-site loops in eEIC (left), etEIC (center), and teEIC (right) are shown as a gray mesh contoured at 0.5σ. (d) c(s) distributions for eEIC (top-left), tEIC (top-right), etEIC (bottom-left), and teEIC (bottom-right) obtained at different loading concentrations (ranging from ~50 to 10 μM) based on sedimentation velocity absorbance data collected at 50 kilo-revolutions per minute and 20 °C (see Methods). The sedimentation experiments indicate that EIC is dimeric for all tested constructs within the tested concentration range. Peaks at S20,W < 4 S that do not show concentration dependent c(s) absorbance profiles (i.e. they do not report on the monomer–dimer equilibrium) are attributed to small amounts of contaminants in the analytical ultracentrifugation sample. (e) Number of interatomic contacts among heavy atoms in the active-site loops of eEIC (blue), tEIC (red), etEIC (orange), and teEIC (green). Contacts for atom i were calculated as the number of heavy atoms within a distance of 5 Å from atom i. Data displayed in bar graph are the sum of intrasubunit and intersubunit contacts. NMR spectra for all EIC constructs and chemical shift perturbations introduced by the 21 single-point mutations are shown in Supplementary Figures S8 and S9.

