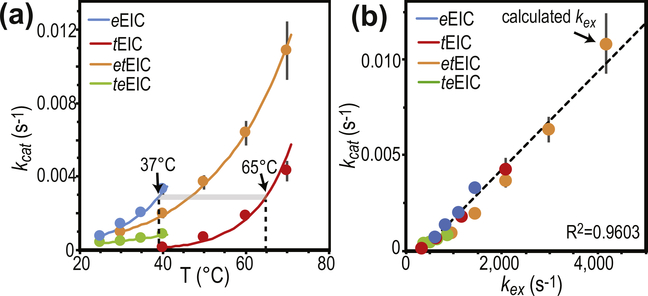
Figure 6.
Temperature dependence of PEP hydrolysis. (a) Turnover number (kcat) versus temperature for the PEP hydrolysis reaction catalyzed by eEIC (blue), tEIC (red), etEIC (orange), and teEIC (green). Experimental data are shown as filled-in circles. Modeling of the experimental data using the Eyring equation is shown as solid lines. Vertical dashed lines are at the optimal PTS temperatures for eEIC (37 °C) and tEIC (65 °C). (b) kcat values are plotted versus the corresponding kex values (i.e. kcat measured for eEIC at 40 °C is plotted versus kex measured for eEIC at 40 °C). Blue, red, orange, and green circles are for eEIC, tEIC, etEIC, and teEIC, respectively. The value of kex at 70 °C for etEIC was calculated using the Eyring equation and the Δ‡H and Δ‡S values reported in Supplementary Table S1.

