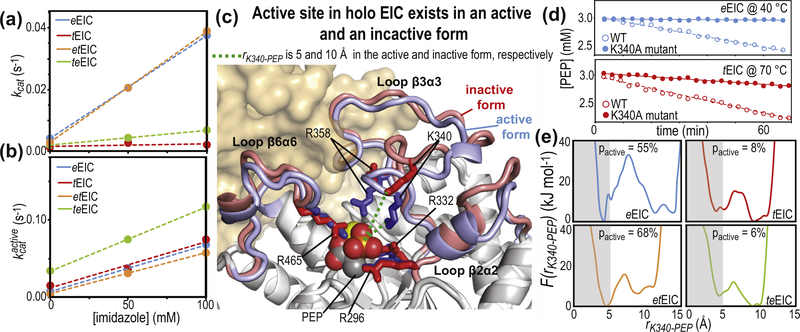
Figure 7.
Conformational heterogeneity regulates EIC activity. (a) Turnover number (kcat) versus imidazole concentration for PEP degradation (i.e. the sum of PEP hydrolysis and imidazole phosphorylation, see Supplementary Figure S7c) catalyzed by eEIC (blue), tEIC (red), etEIC (orange), and teEIC (green). Experimental data are shown as filled-in circles. Linear regressions are shown as dashed lines. (b) kcat values reported in (a) are rescaled according to , were pactive is the fractional population of activated EIC and is the turnover number associated with EIC in the active conformation. (c) The coordinates of eEIC from the crystal structure of phosphorylated, closed eEI (that was used to generate the atomic-resolution model of the eEIC–PEP complex, see caption to Figure 1(a)) are superimposed onto the crystal structure of the tEIC–PEP complex. The active-site loops are colored blue and red for eEIC and tEIC, respectively. Positively charged side-chains coordinating PEP are shown as solid sticks. PEP is shown as spheres. The magnesium ion is shown as a yellow sphere. The second subunit is shown as transparent surface. The distance between the phosphate group of PEP and the ε-ammonium group of Lys340 (rK340-PEP) is shown as a dashed green line. (d) PEP concentration versus time measured on samples containing 3 mM PEP and 50 μM enzyme. Data in the top panel are for the wild-type eEIC (filled-in blue circles) and the eEIC Lys340Ala mutant (open blue circles) at 40 °C. Data on the bottom panel are for the wild-type tEIC (filled-in red circles) and the tEIC Lys340Ala mutant (open red circles) at 70 °C. Linear regressions of the data are shown as solid or dashed lines for the wild-type and mutant enzymes, respectively. (e) Potential of mean force versus rK340-PEP obtained from 1-μs MTD simulations run on the complexes formed by PEP with eEIC (blue), tEIC (red), etEIC (orange), and teEIC (green). Values of pactive were obtained by integrating F(rK340-PEP) over rK340-PEP < 5 Å (gray box).

