Figure 3.

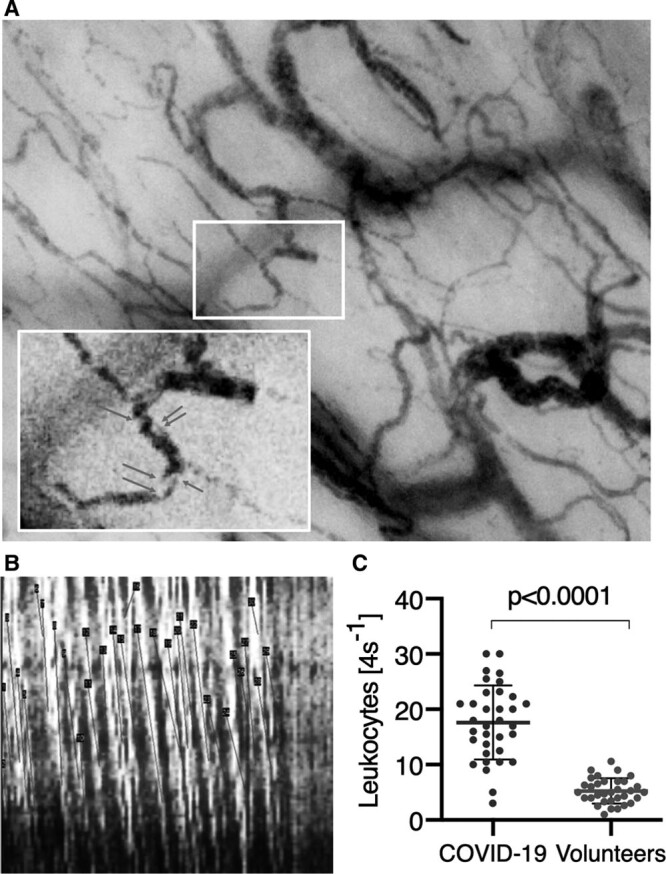
Microcirculatory leukocytes in coronavirus disease 2019 (COVID-19) patients. A, Examples of leukocytes present in the microcirculation are shown. B, Presence of leukocytes can be seen in a space time diagram as slanted white lines as they travel down the length of a capillary (y-axis) over time (x-axis). The number of such white lines per 4-s clip is used to calculate the number of leukocytes. The dark slanted lines measure the presence of the RBC lines. The slopes of these lines are used to calculate RBC velocities. C, The total number of leukocytes measured in capillary-postcapillary venule units shows that there are significantly more microcirculatory leukocytes in the COVID-19 patients than in the volunteers.
