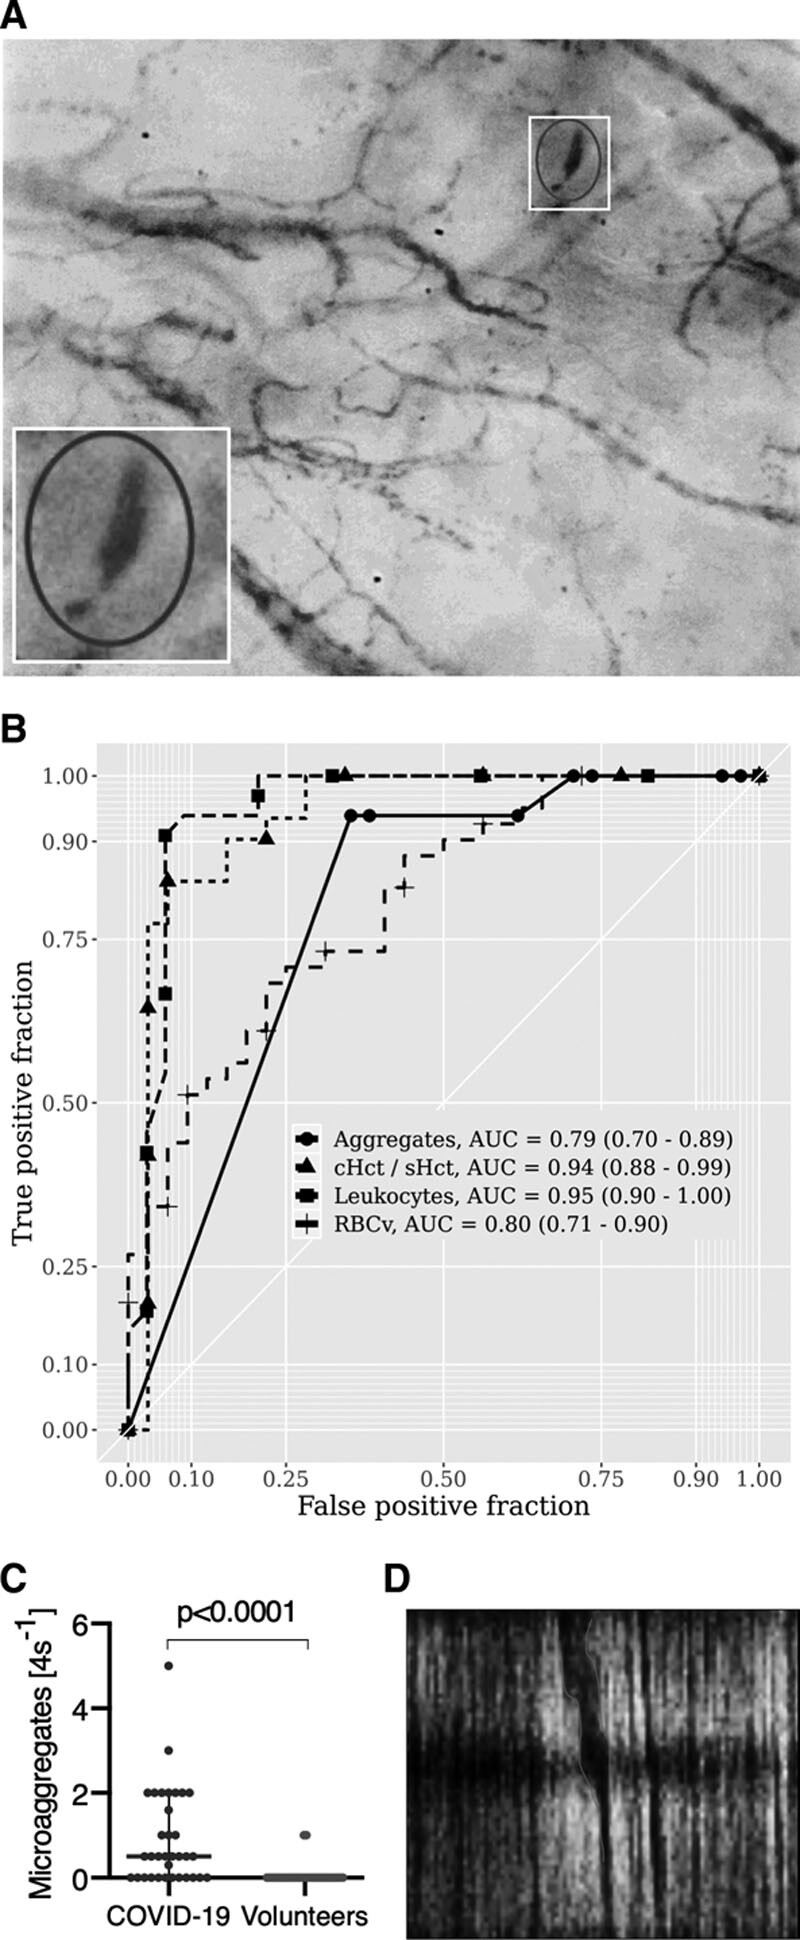
Figure 4.

Microaggregates in coronavirus disease 2019 (COVID-19) patients. A, An example of a plugged vessel with microaggregates. B, Receiver-operating-characteristic curve analysis of the number of leukocytes, RBC microaggregate, the capillary-to-systemic hematocrit (cHct/sHct) ratio, and RBC velocity (RBCv) show that the number of leukocytes, cHct/sHct, and RBCv show the highest sensitivity and specificity for distinguishing COVID-19 patients from volunteers. C, The raised number of microaggregates measured in the image segments of the COVID-19 patients was much higher than that found in the volunteers. D, Presence of an RBC microaggregate as a dark thick band in the space time diagram indicative of RBC clumping in this capillary vessel. AUC = area under the curve.
