
Figure 1. Costs versus benefits of quarantine depending on time.
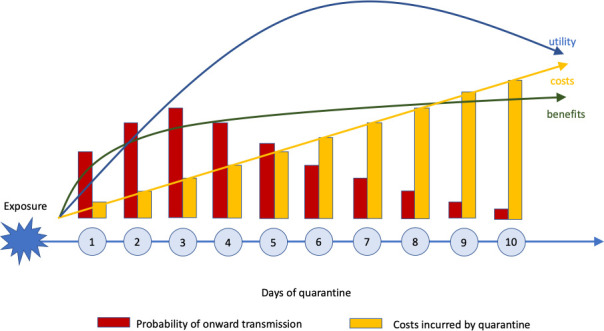
The costs of quarantine (yellow bars and arrow) increase steadily with time, while the benefits (green arrow) – measured as number of onward transmissions (red bars) prevented – increase steeply at first, and then flatten. Ashcroft et al. estimate that balance between costs and benefits – known as the utility (blue arrow) – increases at first, reaching a peak after 6–8 days, and then decreases.