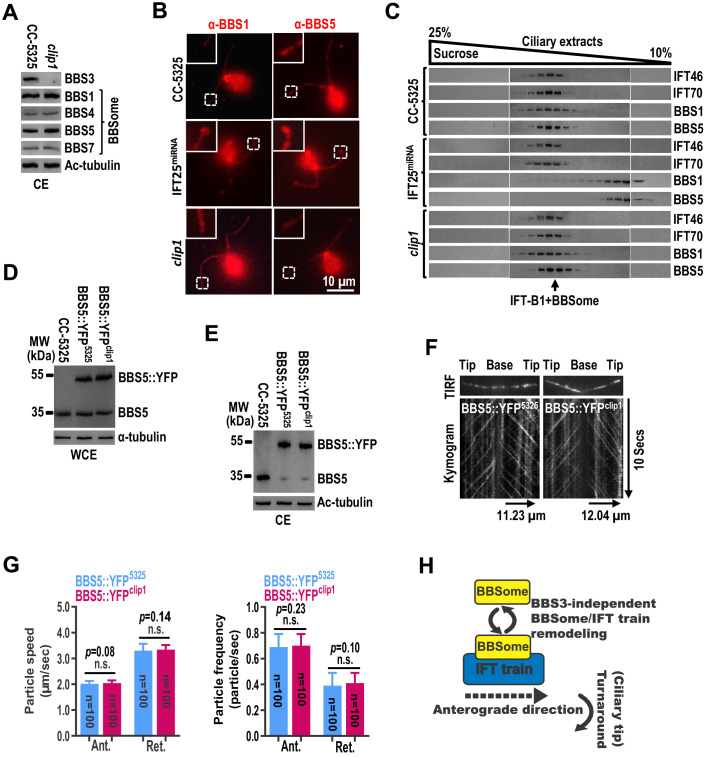
Figure 6. The BBSome cycles through cilia normally in the absence of BBS3 in cilia.
(A) Immunoblots of ciliary extracts (CE) of CC-5325 and clip1 cells probed for BBS3 and the BBSome subunits BBS1, BBS4, BBS5, and BBS7. Ac-tubulin was used to adjust the loading. (B) CC-5325, IFT25miRNA, and clip1 cells stained with α-BBS1 (red) and α-BBS5 (red). Inset shows ciliary tips. Scale bar 10 µm. (C) Immunoblots of sucrose density gradient of CE of CC-5325, IFT25miRNA, and clip1 probed with α-IFT46, α-IFT70, α-BBS1, and α-BBS5. (D and E) Immunoblots of whole-cell extracts (WCE) (D) and CE (E) of CC-5325, BBS5::YFP5325, and BBS5::YFPclip1 cells probed with α-BBS5. α-tubulin and Ac-tubulin were used to adjust the loading of WCE and CE, respectively. (F) Total internal reflection fluorescence images and corresponding kymograms of BBS5::YFP5325 and BBS5::YFPclip1 cells (Figure 6—videos 1 and 2, 15 fps). The time and transport lengths are indicated on the right and on the bottom, respectively. (G) Speeds and frequencies of BBS5::YFP inside cilia of BBS5::YFP5325 and BBS5::YFPclip1 cells are similar. The speeds of BBS5::YFP were 2.01 ± 0.12 (anterograde) and 3.31 ± 0.27 μm/sec (retrograde), and the frequencies were 0.69 ± 0.10 (anterograde) and 0.39 ± 0.10 particles/sec (retrograde) for BBS5::YFP5325 cells. In cilia of BBS5::YFPclip1 cells, the speeds of BBS5::YFP were 2.04 ± 0.11 (anterograde) and 3.34 ± 0.19 μm/sec (retrograde), and the frequencies were 0.70 ± 0.09 (anterograde) and 0.41 ± 0.08 particles/sec (retrograde). Error bar indicates SD. n: number of cilia analyzed; n.s.: non-significance. (H) Schematic presentation showing that the BBSome and IFT trains remodel at the ciliary tip in a BBS3-independent manner.

