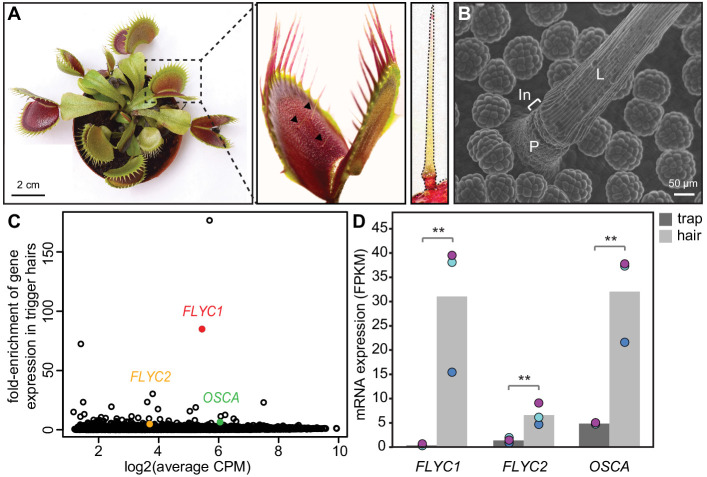
Figure 1. Identification of putative mechanosensory channels in the Venus flytrap trigger hair.
(A) Representative image of a soil-grown Venus flytrap clone (left), Venus flytrap leaf (center), and single trigger hair (right). Black arrowheads in the center picture indicate trigger hairs on leaf. (B) Scanning electron micrograph of a trigger hair. Cells of the lever (L), indentation zone (In) and podium (P) are indicated. Also seen are the digestive glands on the floor of the lobe. (C) Fold enrichment of protein-coding genes of >100 amino acids in length (black circles) in the trigger hair relative to the trap. FLYC1, FLYC2, and OSCA are shown in red, orange, and green, respectively. CPM, counts per million of mapped sequencing reads. (D) Average Fragments Per Kilobase of transcript per Million mapped reads (FPKM) for FLYC1, FLYC2, and OSCA in traps and trigger hairs. Dots of the same color indicate paired biological replicates. **FDR < 0.005.


