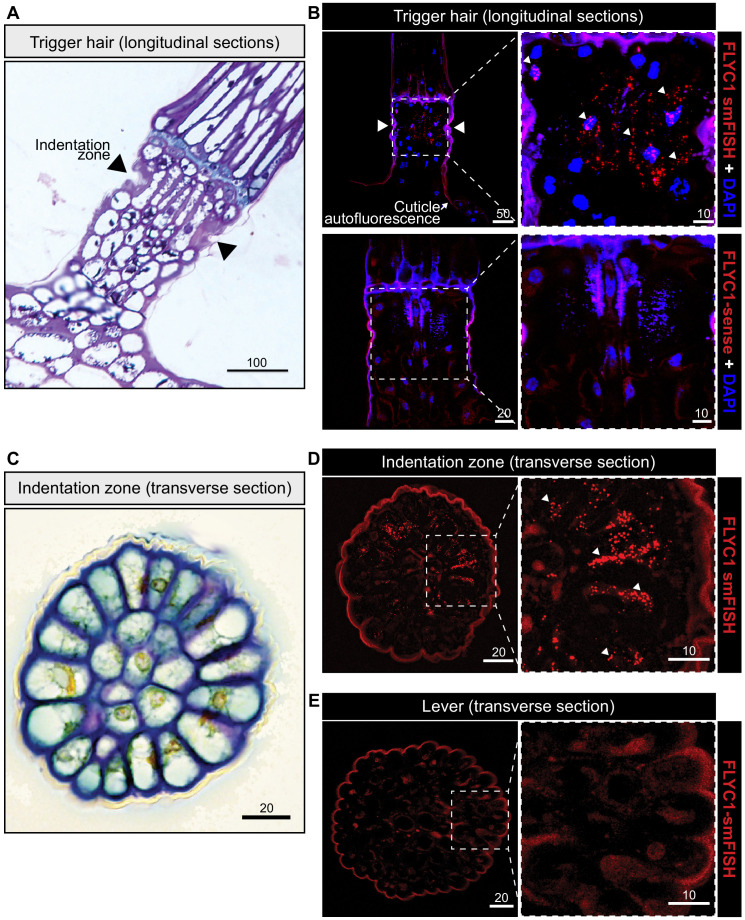
Figure 3. FLYC1 mRNA localization in Venus flytrap trigger hairs.
(A) Toluidine blue-stained longitudinal section through the base of a trigger hair. Elongated sensory cells are visible at the indentation zone (arrowheads). (B) Max projection through a longitudinal section after fluorescent in situ hybridization. (Top) FLYC1 transcript (red) and DAPI (blue) at low (left) and high (right) magnification of the indentation zone. Note localization of the FLYC1 transcript puncta in sensory cells. (Bottom) No signal was observed when using FLYC1-sense probes. High background fluorescence is observed in all channels. (C) Toluidine blue-stained transverse section through the indentation zone. The cells forming the outer ring are presumed to be the mechanosensors (Benolken and Jacobson, 1970). (D) Max projection through a transverse section after fluorescent in situ hybridization. FLYC1 transcript (red) at low (left) and high (right) magnification. Note localization of the FLYC1 transcript puncta predominantly in the sensory cells of the indentation zone. (E) Max projection through a transverse section of the trigger hair lever. No transcript was observed. Scale bars, μm.


