. 2021 Mar 16;10:e64250. doi: 10.7554/eLife.64250

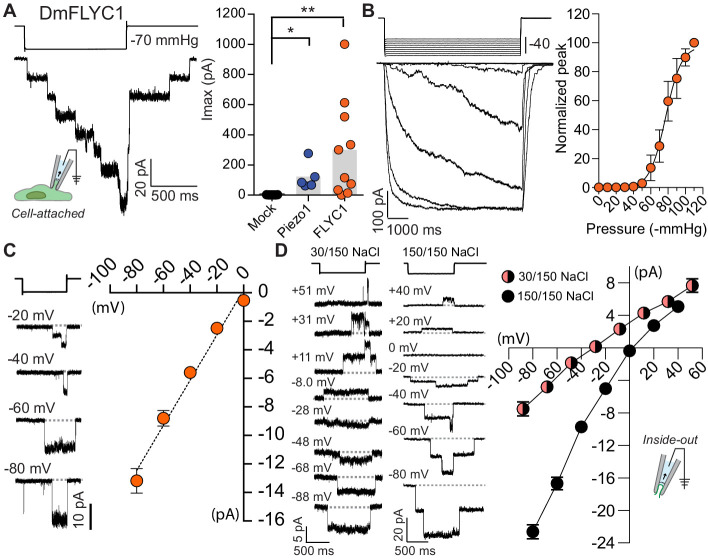
Figure 4. FLYC1 induces stretch-activated currents.

(A) Left, representative trace of stretch-activated current recorded from FLYC1-expressing HEK-P1KO cells in the cell-attached patch clamp configuration at −80 mV membrane potential in response to −70 mmHg pipette pressure. Stimulus trace illustrated above the current trace. Right, quantification of maximal current response from cells transfected with mock (N = 7), mouse PIEZO1 (N = 5), or FLYC1 plasmid (N = 10). p=0.0251 (mock vs. PIEZO1); p=0.0070 (mock vs. FLYC1); Dunn’s multiple comparison test. (B) Left, currents in response to graded negative pressure steps from 50 to 90 mmHg (Δ5 mmHg) at −60 mV membrane potential. Right, average pressure–response curve normalized to peak current across cells (pressure–response curve for absolute peak values is plotted in Figure 4—figure supplement 2). A fit with Boltzmann equation revealed P50 value of 77 mmHg (N = 9). (C) Left, representative single-channel traces in response to stretch at the indicated membrane potential. Right, average I–V relationship of stretch-activated single-channel currents from FLYC1-transfected cells (N = 6). (D) Left, representative stretch-activated single-channel currents recorded from excised inside-out patch configuration in asymmetrical or symmetrical NaCl solution at the indicated membrane potential. Right, average I–V of stretch-activated single-channel currents in asymmetrical NaCl solution (N = 7, red/black circles) or symmetrical NaCl solution (N = 8, black cirlces). Data for both conditions were collected from separate patches/cells. Scatter plots in B–D are mean ± s.e.m.

Figure 4.

Figure 4—figure supplement 1. DmFLYC2 and DmOSCA functionality.
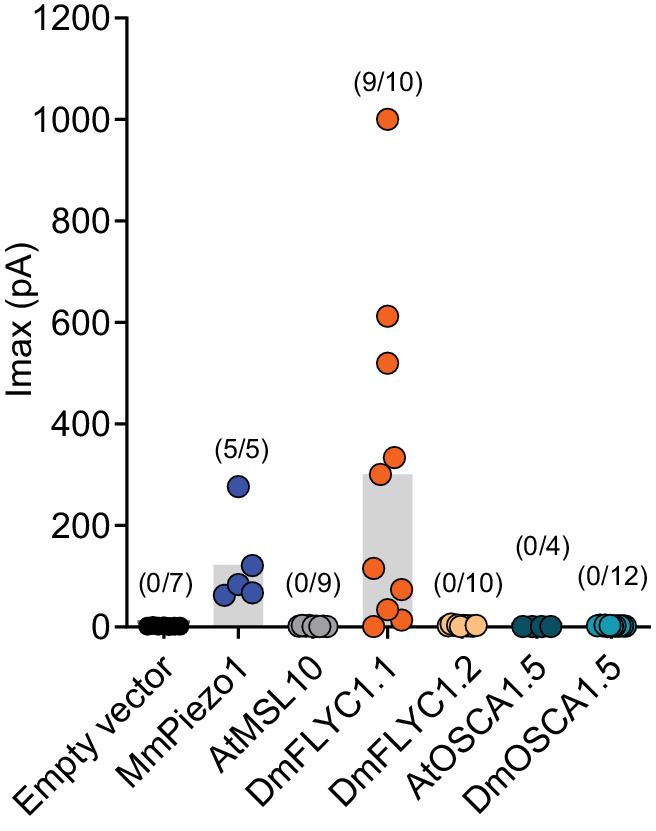
Figure 4—figure supplement 1.

Macroscopic stretch-activated currents recorded from HEKP1-KO cells transfected with Mock (N=7), MmPiezo1 (N=5), AtMSL10 (N=9), DmFLYC1 (N=10), DmFLCY2 (N=10), AtOSCA1.5 (N=4), and DmOSCA (N=12) plasmids. Empty vector, MmPiezo1, and DmFLYC1 data is the same as Figure 4A.

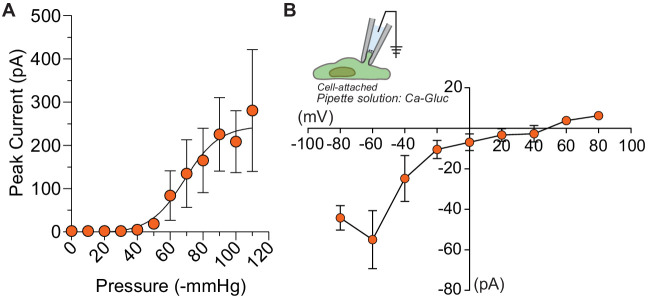
Figure 4—figure supplement 2. Half-maximal pressure response and chloride permeability in DmFLYC1.

Figure 4—figure supplement 2.

(A) Average pressure response curve across different cells (N=9). Same data as Figure 4B but the peak current is not normalized to maximal response. (B) Average I–V (N=5) of DmFLYC1 stretch-activated currents recorded in cell attached patch clamp configuration. Scatter plots are mean ± s.e.m .

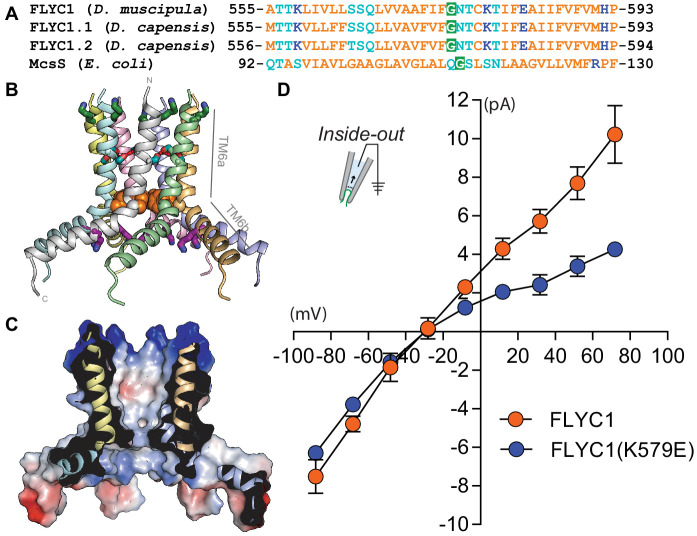
Figure 4—figure supplement 3. The sequence of a putative pore-forming helix in FLYC1 is compatible with MscS-like channel structure.

Figure 4—figure supplement 3.

(A) Sequence alignment of the putative pore helix of Venus flytrap FLYC1 and Drosera DcFLYC1.1 and DcFLYC1.2 proteins with MSL10 and MscS. Nonpolar, polar, and ionizable residues are orange, light blue, and dark blue, respectively. A glycine predicted to localize at a central bend in the helix is shaded green. (B) Modeled heptameric organization. The sequence of Venus flytrap FLYC1 was threaded on the inner helix of heptameric MscS in a closed conformation (PDB 2OAU), and minimized using the Rosetta energy function while imposing C7 symmetry. Subunits are shown in different colors. Basic residues K558 and K579 are green and purple sticks, respectively. Predicted intersubunit hydrogen bonds between serines S564 and S565 (light blue sticks) of pore segments are shown with red dashes, while a ring of phenylalanines (F572; orange spheres) constrict the pore. Helices TM6a, forming the central pore, and amphipathic helix TM6b are indicated for one pore segment. (C) A cross-section through the protein surface colored by electrostatic potential, showing an uncharged (white) pore, with positive charge (blue) above and below the pore. (D) Average I–V of stretch-activated single-channel currents from FLYC1 (N=7) and FLYC1(K579E) (N=4) in asymmetrical NaCl solution. FLYC1 data is the same as Figure 4D. Scatter plots are mean ± s.e.m.