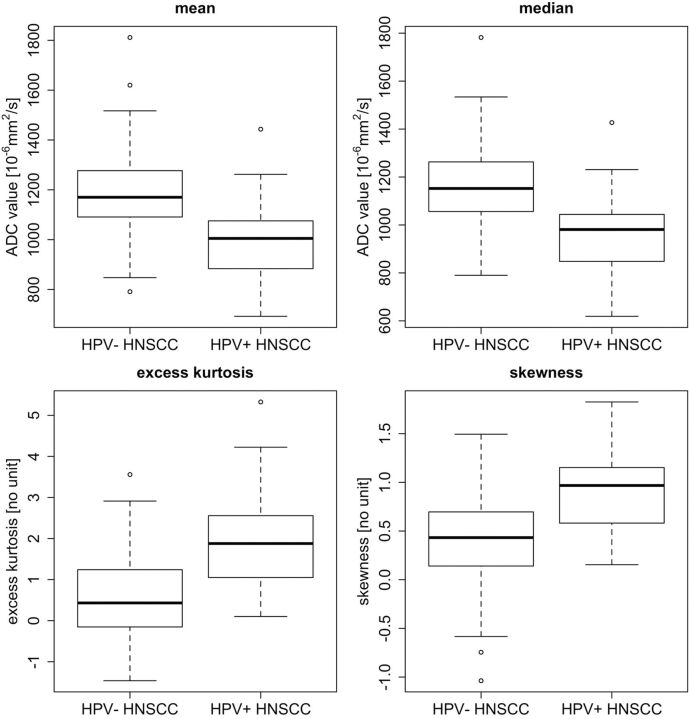
Fig 1.
Box plots for mean ADC, median ADC, excess kurtosis, and skewness from ROIs obtained in 105 tumors (84 HPV− HNSCC and 21 HPV+ HNSCC). Horizontal lines indicate median values (black lines). The bottom and the top of the box are the first and third quartiles whereas whiskers indicate maximum and minimum values. Outliers are indicated by circles.

