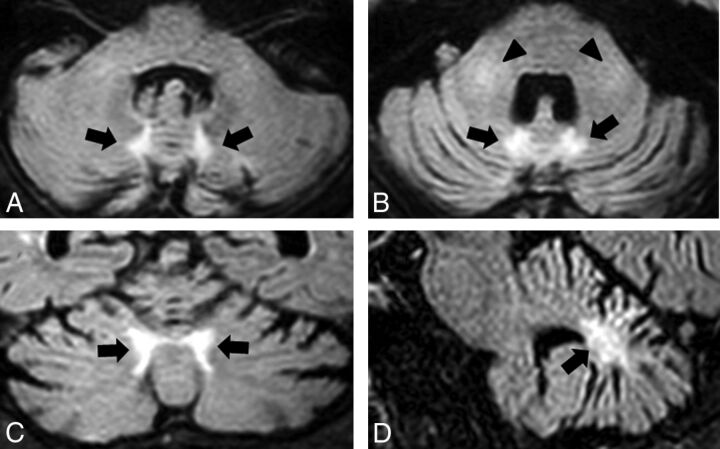
Fig 1.
A representative case (patient 1) showing the abnormal signals at the paravermal area and the middle cerebellar peduncle. FLAIR axial images (A and B), a coronal image (C), and a sagittal image (D) show atrophy of the cerebellum and bilateral high signal intensity in the medial part of the cerebellar hemisphere immediately beside the vermis (the paravermal area) (black arrows) and in the middle cerebellar peduncle (black arrowheads).

