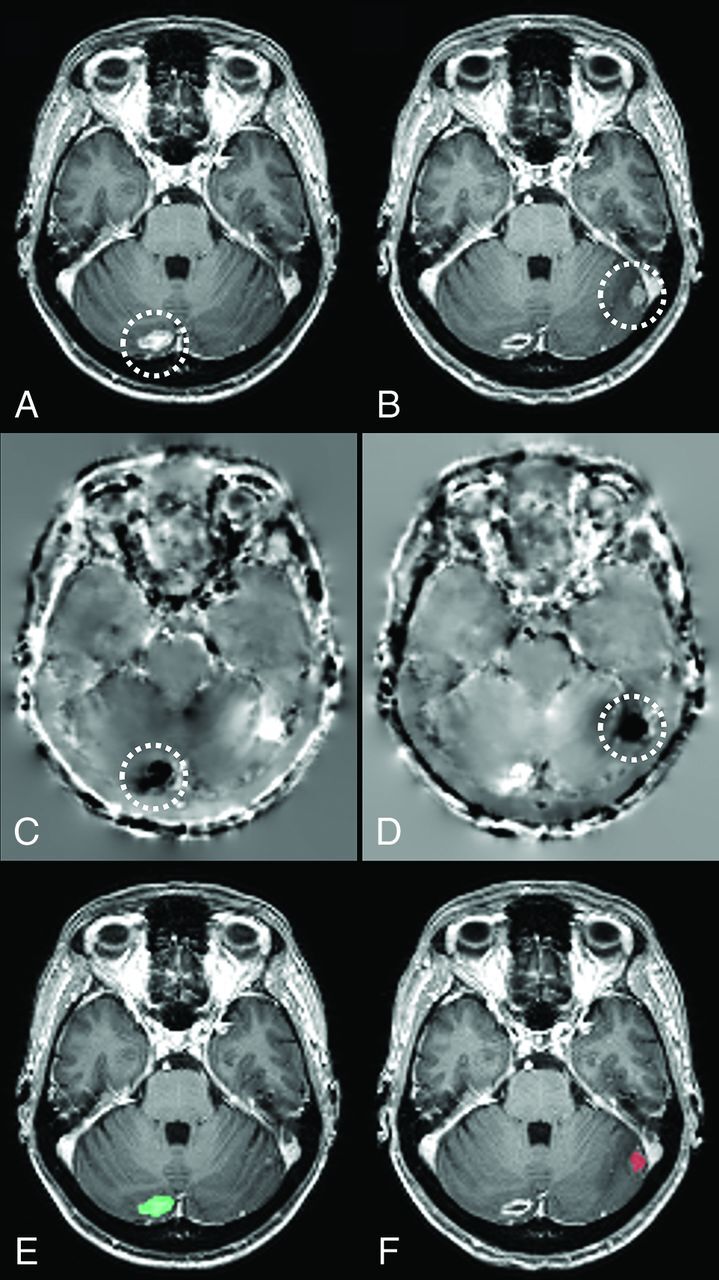
Fig 2.

Axial sections of a patient's baseline (A) and follow-up (B) scans. The Jacobian operator field, calculated from the deformation field in the forward (C) and reverse (D) directions. The final output of our algorithm produced for baseline (E) and follow-up (F) scans, highlighting volume-changing metastatic brain tumors on each scan. Note that darker voxels on C and D correspond to negative JOF values and brighter voxels correspond to positive JOF values. The location of a metastatic brain tumor that has shrunk in size across the scans has been circled on A–D. The green on E indicates shrinkage, and the red on F indicates growth. Note that while this image is demonstrated in 2D, various operations as described here were performed in 3D.
