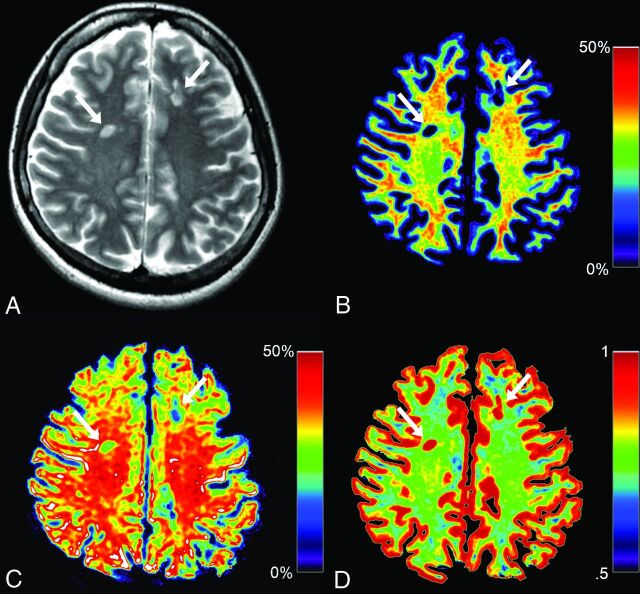
Fig 1.
Representative images from a patient with MS. Synthetic T2WI (A) and maps of myelin volume fraction (B), axon volume fraction (C), and g-ratio (D) are shown. Two plaques are designated by arrows in these images. Even though myelin is severely damaged in these plaques (B, 5.53% and 7.23%), the degrees of axon damage are milder (C, 31.30% and 22.95%). Because myelin is severely damaged in these plaques, corresponding g-ratios are close to 1.00 (D, 0.94 and 0.91).

