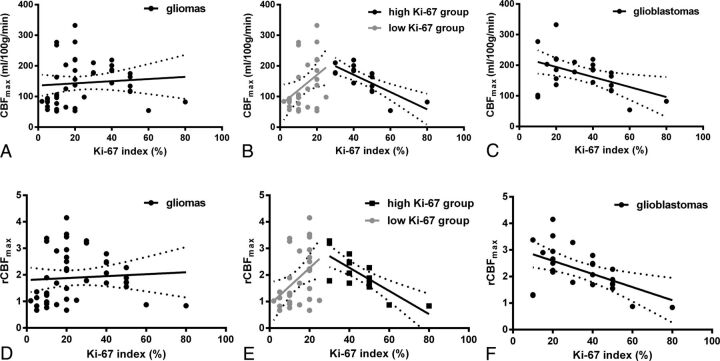
Fig 4.
The linear regression of CBFmax (A–C) and rCBFmax (D–F) with the Ki-67 index in all subjects (A and D), in the low and high Ki-67 groups (B and E), and in glioblastomas (C and F). The low Ki-67 group included patients with a Ki-67 index of <30%, and the high Ki-67 group included patients with a Ki-67 index of ≥30%.

