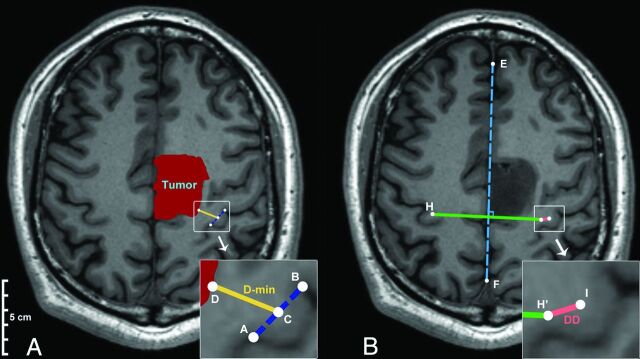
Fig 1.
The mathematic model used to quantify the anatomic characteristics (the original magnification of the smaller pictures was ×200%). A, Representation of the calculation of D-min. Points A and B represent the ends of the hand knob. Point C represents the midpoint of the hand knob on the lesion hemisphere. Point D is a point on the tumor boundary that is closest to the Point C. D-min is shown as the gold line. B, The WAN model was used to calculate the DD. The dotted blue line indicates the midline of the brain. Points H and I are the midpoints of the hand knobs on the healthy and lesion hemispheres, respectively. Point H′ is the point that mirrors H on the basis of the midline of the brain (dotted blue line). The pink line represents the DD.

