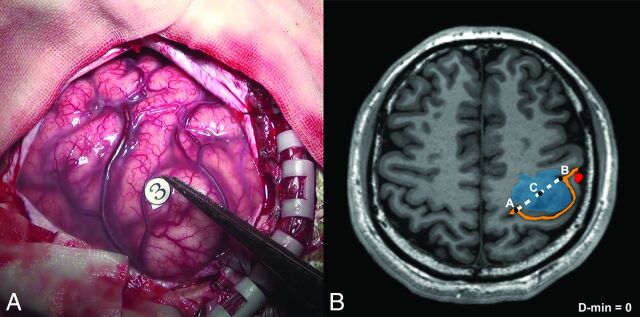
Fig 2.
Example of the DCS-positive site and D-min (patient No. 9). A, The hand motor area is identified by intraoperative brain mapping. The marker 3 represents thumb buckling when stimulated in this region. B, Points A and B represent the ends of the hand knob. The midpoint of the hand knob (point C) in the lesion hemisphere is shown (midpoint of line AB). In this case, the shortest distance from the tumor to the hand knob is zero. The blue region is the tumor, the orange line is the central sulcus (with the Ω sign), and the red region is blood oxygen level—dependent functional MR imaging results.

