Fig 6.
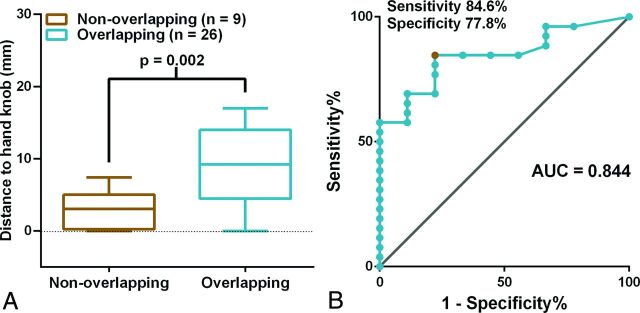
The relationship between D-min and the nonoverlapping phenomena of BOLD fMRI and a comparison with DCS results. A, The boxplot shows that D-min is significantly different between the overlapping and nonoverlapping groups (t test). The middle line in each box is the mean value; the horizontal boundaries of the boxes are the first and third quartiles. The topmost line is the maximum value, and the bottommost line is the minimum value. B, Receiver operating characteristic curves are used to assess whether the BOLD fMRI and DCS results overlap. The results for sensitivity are plotted against 1-specificity to compare BOLD fMRI versus DCS. The gray line is the reference line. The red point represents the optimal point for which the best cutoff value was 4 mm, with a sensitivity of 84.6% and a specificity of 77.8%. AUC indicates area under the curve.

