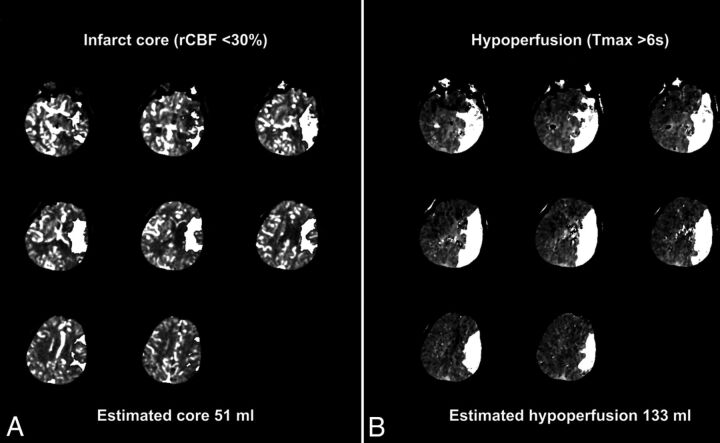
Fig 1.
CT perfusion mismatch maps for infarct core and penumbral volume estimates. Representative sample of the CT perfusion analysis pipeline with estimated infarction core (A) determined as relative cerebral blood flow <30% of normal and total hypoperfused tissue volume (B) measured from regions of time-to-maximum of residue function of >6 seconds. Lesion estimates (white overlays) produced from sequential sections obtained from presentation CT perfusion in a 62-year-old woman presenting with acute left MCA syndrome. Segmented lesions are overlaid on raw perfusion images for review purposes, and automated lesion volumes are produced as shown. Penumbral mismatch is computed from the difference between estimated lesion volumes and is summed for each of 2 contiguous perfusion slabs.

