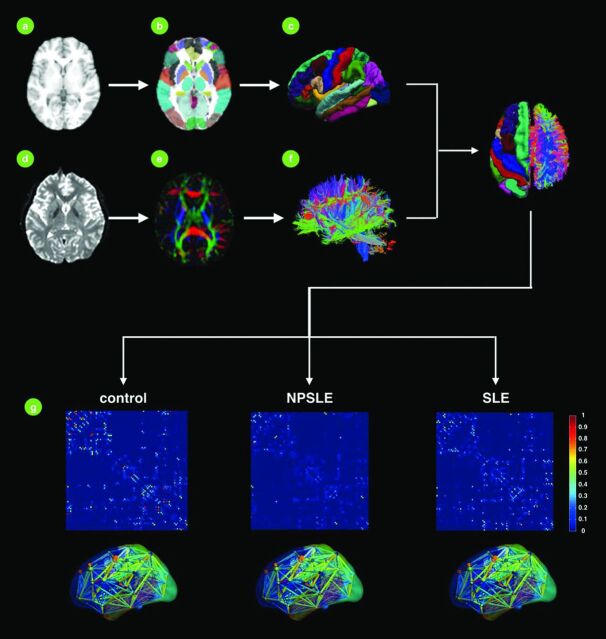
Fig 1.
A flowchart of the postprocessing required for brain connectivity analysis. For each subject, T1-weighted anatomic images (A) were registered to non-diffusion-weighted images and subsequently to the International Consortium for Brain Mapping 152 template. The resulting transformation matrix was then used to bring various brain regions or ROIs (B and C) from the Automated Anatomical Labeling atlas into the native anatomic image space. Diffusion tensor was obtained from diffusion-weighted images (D); and its associated diffusion metrics, such as color-coded fractional anisotropy maps (red, left to right; green, anterior to posterior; blue, inferior to superior), were subsequently obtained for constructing the whole-brain white matter tractogram (F). After we combined the tractogram (F) and ROIs (C), the connectivity matrix (G), which records the connections among all ROIs, was obtained for subsequent group analysis.

