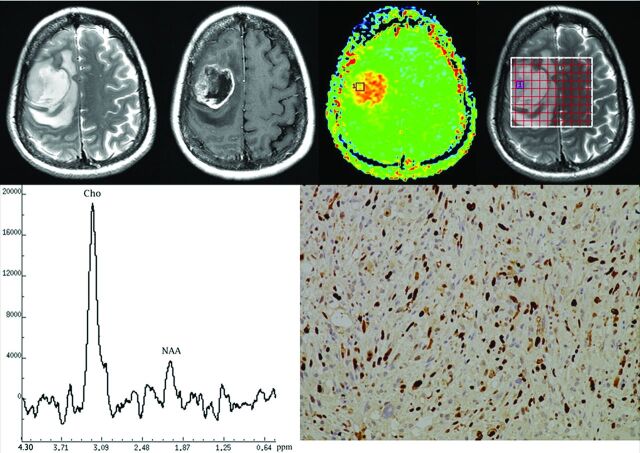
Fig 3.
Top row, left to right: T2 FSE MR image, postgadolinium T1-weighted MR image, APT image, and the location of MR spectroscopy voxel of a 46-year-old woman with anaplastic oligodendroma (grade III). Bottom row, left to right: MRSI indicating peaks for choline (Cho) and N-acetylaspartate (NAA), and Ki-67 immunohistochemical staining for the same patient. The MTRasym(3.5ppm) value for this patient was 4.39%; the choline peak was obviously increased and the NAA peak obviously decreased; and the Ki-67 labeling index was 30%.

