
Fig 3.
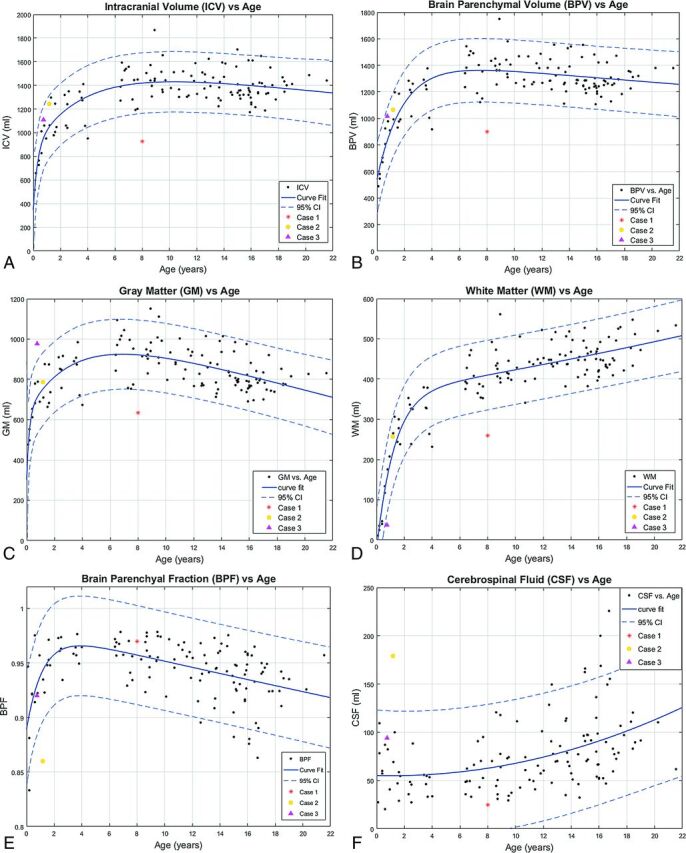

Segmentation volume plots versus patient age. A, ICV. B, BPV. C, GM. D, WM. E, BPF. F, CSF. G, MY. H, MYF. Solid lines denote curve fit functions. Dashed lines denote 95% confidence intervals. Data points for the 122 healthy patients are denoted by black dots. Three illustrative cases with abnormal exams are superimposed on the normal plots. Case 1 is a purple triangle, Case 2 is an orange circle, and unhealthy Case 3 is a red asterisk. (Normal plots without the superimposed cases can be found in the On-line Figs 1 and 2).