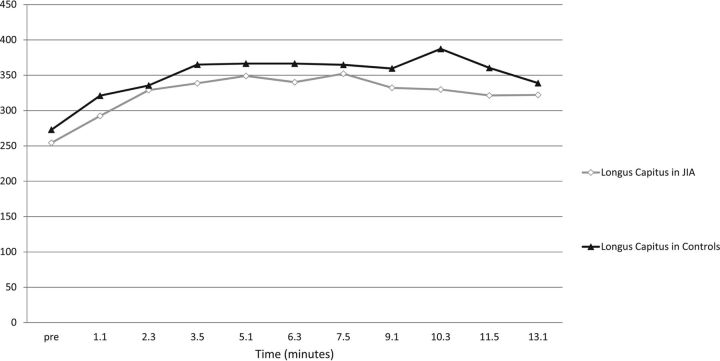
Fig 3.
Raw T1 hyperintensity curves of the longus capitis muscle as measured on the precontrast image and each of the 10 postgadolinium dynamic images. The raw signal of the longus capitis is similar at all sampling time points in both the JIA and control groups: no statistically significant difference (P = .99) was seen at any time point, suggesting that the longus capitis may serve as a normalization standard for both normal and symptomatic groups.

