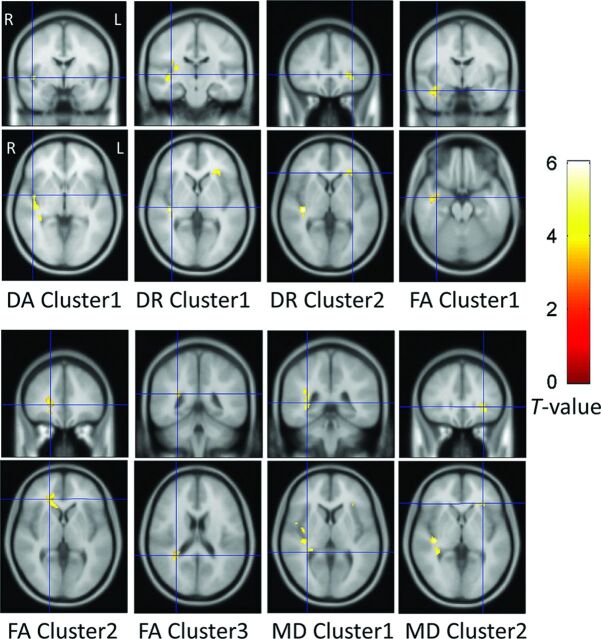
Fig 2.
Voxel-based analysis results. The DA, DR, and MD were significantly increased and the FA was significantly decreased in the presbycusis group compared with the healthy control group (P < .001 at voxel level, uncorrected; P < .05 at cluster level, family-wise error–corrected). Each cluster contains more than 100 adjacency voxels that show significant variation of those diffusion parameters. For example, DA cluster 1 denotes the first group of voxels that show significant intergroup difference of DA, whereas DR cluster 1 denotes the first group of voxels that show significant intergroup difference of DR. The significant voxels are displayed with their T-values. The ascending T-values are shown from darkness to brightness. Each panel displays a single cluster with its location indicated by a blue section marker.

