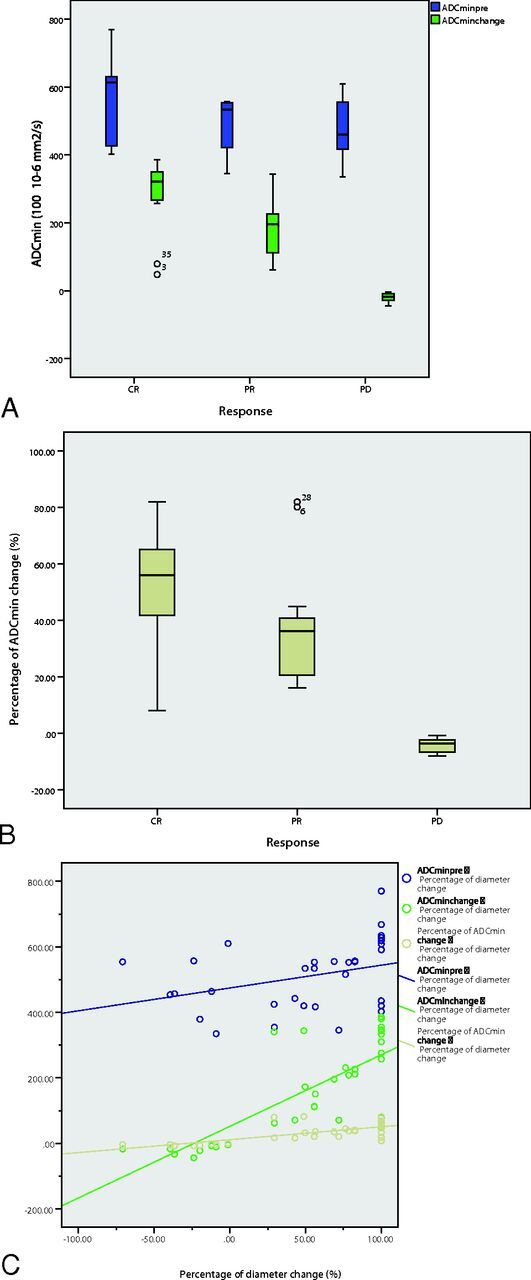
Fig 4.

A boxplot of ADCminpre and ADCmin early change in the CR, PR, and PD groups (A). A boxplot of percentage ADCmin change in the CR, PR, and PD groups (B). ADCmin early change and percentage ADCmin change values can differentiate the 3 groups. The percentage ADCmin change performed better in differentiating the final treatment response, specifically differentiating the CR and PR groups from the PD group (A and B). C, Correlation between ADCminpre and percentage of the diameter (R2 = 0.046, blue), correlation between ADCmin early change and percentage of the diameter (R2 = 0.576, green), and the correlation between the percentage of ADCmin early change and percentage of the diameter (R2 = 0.717, yellow).
