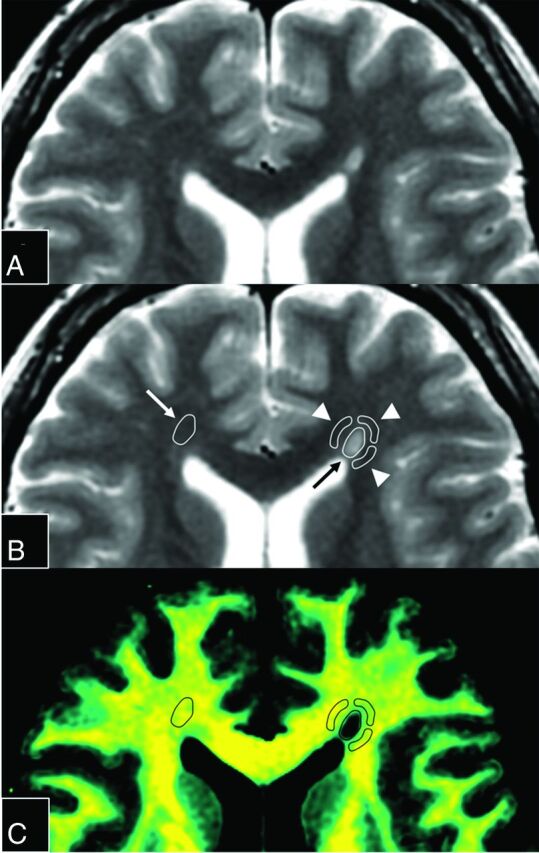
Fig 2.

Magnified images of Fig 1A. The upper 2 panels show the same synthetic T2-weighted image without (A) or with (B) placement of ROIs. An ROI (black arrow) was drawn on a plaque adjacent to the left anterior horn, and 3 ROIs (arrowheads) were placed on periplaque white matter to encircle the plaque. The fourth ROI on PWM was discarded because it overlapped the CSF. The ROI of the plaque was copied and pasted onto the contralateral normal-appearing white matter (white arrow). These ROIs were then copied and pasted onto each quantification map. A map of the corresponding myelin partial volume (C) is shown as an example.
