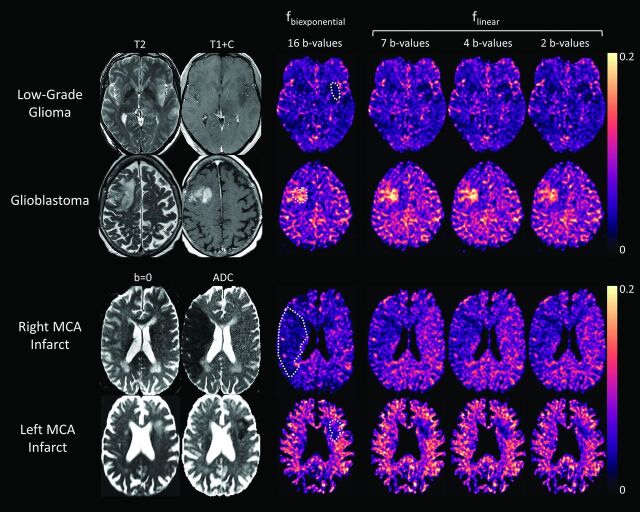
Fig 1.
Anatomic images and IVIM perfusion maps for 4 clinical cases. fbiexponential is the perfusion fraction estimate of the conventional biexponential fit (16 b-values) and flinear is the perfusion fraction estimate of the simplified linear fit using 2–7 nonzero b-values. Upper row: T2-weighted image, postgadolinium T1-weighted image, and perfusion maps for a patient with a histopathologically confirmed low-grade glial tumor (World Health Organization grade II). A subtle T2-hyperintense, hypoenhancing lesion in the left insular cortex corresponds to a focal region of low perfusion fraction on all perfusion maps. Second row: T2-weighted image, postgadolinium T1-weighted image, and perfusion maps for a patient with histopathologically confirmed glioblastoma (World Health Organization grade IV). A solid enhancing right frontal mass corresponds to a region of increased perfusion fraction on all perfusion maps. Third row: b=0 (ie, T2-weighted) image, ADC map, and perfusion maps for a patient with a large acute right MCA territory infarct, demonstrating a wedge-shaped area of decreased perfusion fraction corresponding to the area of restricted diffusion (infarct core). Lower row: Similar findings in a different patient with a smaller left MCA territory infarct. ROIs for tumors and strokes are shown overlaid on the conventional fbiexponential perfusion maps (dotted white lines).

