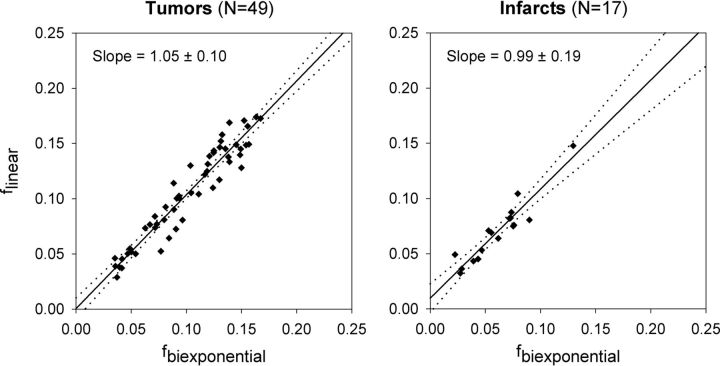
Fig 2.
Plots comparing the perfusion fraction estimated using the conventional 16 b-value biexponential fit (fbiexponential) with those using simplified linear fitting of 7 nonzero b-values (flinear) for tumors (left) and infarcts (right). Solid line indicates the least squares optimal linear regression; dotted lines indicate the 95% confidence interval for the line of best fit. The slope and its 95% confidence interval are also provided for each regression line.

